25 April, 2024
Performance Tracking > 2009 Holiday Season WebSitePulse 2009 Holiday Retail Performance and Uptime ReportThis year the holiday season may not be so happy for the retail industry due to the recession and the tightened strings put on the purse of the average consumer. In his retail sales forecast Anthony L. Liuzzo, J.D.,Ph.D., points our that in 2008, for the first time ever, web sales declined by about 2%, but still accounted for approximately 11% of total holiday retail sales. According to the latest data from Forrester Research, despite the lingering effects of the global financial crisis, the online space remains the retail industry's growth engine. Online sales are expected to have an 8 percent jump over last year, reaching $44.7 billion during the months of November and December 2009. Retailers on the Web will offer sales and discounts as always, but of a more limited time and quantity. Automatic free shipping may be jettisoned in favor of free shipping only above certain price levels, says Forrester. Lance Whitney adds that in order to drive business, online sellers may also take advantage of new trends. More detailed product information will be available, as will social networking tools that let customers share purchasing advice with friends and family. WebSitePulse is monitoring ten of the most popular online shopping destinations for the 2009 Holiday Season. The Reports reflect a typical online purchase transaction, like selecting an item, adding it to the shopping cart and checkout, representative for the End Users' interactions with a website. Measurements of the multi-step transactions are made every 15 minutes, simultaneously from 3 different US cities. The reporting period covers the dates between November 23, 2009 and January 5, 2010.
WebSitePulse reports the following results from web performance measurement of the websites participating in the the Holiday Retail Performance and Uptime Report: The daily Average Response time from all monitored websites was 3.489 sec.
The typical shopping transaction took the least time for overstock.com visitors - 1.943 sec., while the visitors of amazon.com had to be the most patient, as the shopping transaction there took in average of 6.588 sec. Four of the monitored websites delivered above-the-average response times for their transactions, while six of them demonstrated below-the-average daily performance. The daily average uptime for the entire Group was 99.94%.
Eight websites were available with no interruptions - 100%. Eight websites' availability was above the average, while two sites dragged the average down with below-the-average availability. Report Highlights No events of particular importance or possible negative impact on the online visitors' interaction with the Websites included into the 2009 Holiday Season report were detected during the reported period, and according to WebSitePulse, the Group delivered the expected levels of End-User experience and Customer satisfaction. Please, scroll down for Detailed Reports and Charts provided by WebSitePulse: Daily Response Times 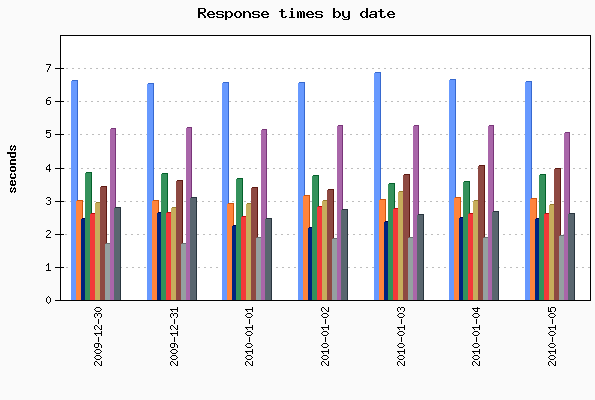
Average Response Times for January 05, 2010
Average Response Times November 23, 2009 - January 05, 2010
Hourly Average Response Times Select individual website to display: 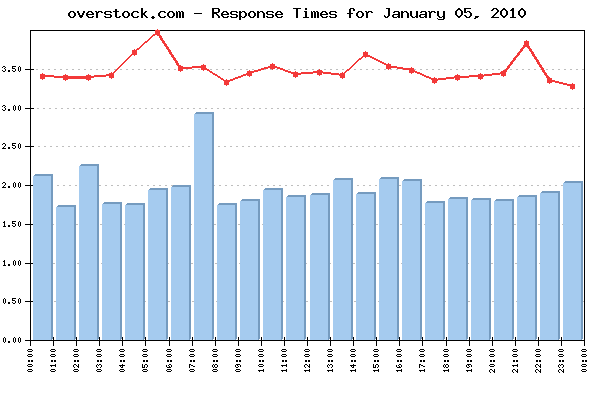 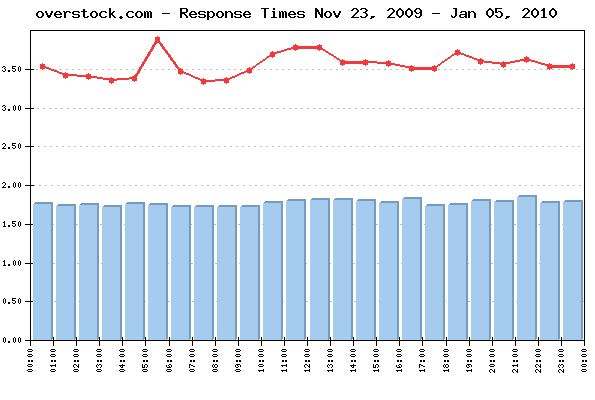
Average response times by hour for January 05, 2010
Average response times by hour November 23, 2009 - January 05, 2010
Uptime Uptime January 05, 2010
Uptime November 23, 2009 - January 05, 2010
Methodology: The 2009 Holiday Season Reports reflect a complete web transaction, representative for the End Users' interactions with a website. The reporting period covers the dates between November 23, 2009 and January 5, 2010. Performance and availability measurements are made for a typical multi-step web transaction at 15 minute monitoring interval, every day 24/7. The WebSitePulse application monitoring service is used to collect data and to create the reports. The steps in each transaction are comparable for all websites, and reflect the real online shopper experience. The simultaneous monitoring is performed from 3 US-based locations of the WebSitePulse monitoring network: Los Angeles, CA, Chicago, IL, and Washington, DC. In case of a detected malfunction or unavailability, the system performs automated error verification from 3 independent resources and only after the above procedure is performed and has returned consistent results, the detected error is confirmed, recorded, and included in the daily performance reports. In these cases, an advanced WebSitePulse exclusive feature comes into play - Forced Monitoring -, which automatically switches to a 3 minute monitoring interval for increased accuracy. About WebSitePulse: WebSitePulse is a leading provider of global, independent, and objective availability and performance monitoring of web sites, servers, network components, web applications, e-business- and email round-trip transactions. Contact: For more information about this report please contact: George T., CTO phone: 1-407-380-1600 email: Reproduction: WebSitePulse launched the Performance and Uptime Reports program to keep the general public and the Internet community informed about the performance of specific websites and the challenges their webmasters, owners and operators are facing on a daily basis, especially when the web traffic intensifies due to some special events through the year. Some of the most popular web destinations, related to each particular event, are selected for the purpose of the Reports, and data from their performance measurements is made available on the WebSitePulse public website. With the intention to broadly disseminate this information for the benefit of the Internet community, we encourage the use of this information without prior approval and under the following Terms and Conditions:
The Data from the performance measurements cannot be changed or manipulated and should be used "as is". | ||||||||||||||||||||||||||||||||||||||||||||||||||||||||||||||||||||||||||||||||||||||||||||||||||||||||||||||||||||||||||||||||||||||||||||||||||||||||||||||||||||||||||||||||||||||||||||||||||||||||||||||||||||||||||||||||||||||||||||||||||||||||||||||||||||||||||||||||||||||||||||||||||||||||||||||||||||||||||||||||||||||||||||||||||||||||||||||||||||||||||||||||||||||||||||||||||||||||||||||||||||||||||||||||||||||||||||||||||||||||||||||||||||||||||||||||||||||||||||||||||||||||||||||||||||||||||||||||||||||||||||||||||||||||||||||||||||||||||||||||||||||||||||||||||||||||||||||||||||||||||||||||||||||||||||||||||||||||||||||||||||||||||||||||||||||||||||||||||||||||||||||||||||||||||||||||||||||||||||||||||||||||||||||||||||||||||||||||||||||||||||||||||||||||||||||||||||||||||||||||||||||||||||||||||||||||||||||||||||||||||||||||||||||||||||||||||||||||||||||||||||||||||||||||||||||||