26 April, 2024
Performance Tracking > 2012 Holiday Season WebSitePulse 2012 Holiday Retail Performance and Uptime ReportThe Holidays season is upon us and so are the holiday shopping sprees. This period is vital for the retailers as holiday sales amount to about a quarter of the overall retail sales for the whole year. If you need further proof of how important holiday sales are for the economy, just picture this - they are expected to increase with yet another 4.1% to $586.1 billion. And that is for November and December alone. Of course, if we take a closer look at the numbers, we will see that that is actually a quite conservative growth compared to last year (5.6%). NRF President and CEO Matthew Shay attributes this tempered forecast to variables which include the presidential election, the confusion surrounding the ‘fiscal cliff’ and the concern relating to future economic growth. Still, the experts are optimistic that the Holiday season will be strong and conclude that with the right promotions retailers will still manage to show solid growth for this year. With the extended use of smartphones and tablets on the rise, it is hardly surprising that shoppers will continue to move online for their purchases. In fact, online sales are expected to hit a new high and grow with over 12% compared to last year. Total online spending this holiday season is estimated at between $92 billion and $96 billion. As usual, we will be monitoring how the most prominent online shopping destinations are coping with the challenge of increased demand and high traffic. That is why between November 21, 2012 and January 6th, 2013 you will be able to see the daily statistics in our Holiday Retail Performance and Uptime Reports. The Reports reflect a typical online purchase transaction, like selecting an item, adding it to the shopping cart and checkout, representative for the End Users' interactions with a website. Measurements of the multi-step transactions are made every 15 minutes, simultaneously from 3 different US cities. The information from the report will provide insight into the End Users' shopping experience, the reliability of the IT infrastructure of the selected Internet retailers, and their estimated losses in case of downtime and failure of critical websites, web pages, web systems, network devices, and web applications.
WebSitePulse reports the following results from web performance measurement of the websites participating in the the Holiday Retail Performance and Uptime Report: The daily Average Response time from all monitored websites was 3.75 sec.
The typical shopping transaction took the least time for overstock.com visitors - 1.652 sec., while the visitors of amazon.com had to be the most patient, as the shopping transaction there took in average of 6.224 sec. Five of the monitored websites delivered above-the-average response times for their transactions, while five of them demonstrated below-the-average daily performance. The daily average uptime for the entire Group was 99.99%.
Eight websites were available with no interruptions - 100%. Eight websites' availability was above the average, while two sites dragged the average down with below-the-average availability. Report Highlights No events of particular importance or possible negative impact on the online visitors' interaction with the Websites included into the 2012 Holiday Season report were detected during the reported period, and according to WebSitePulse, the Group delivered the expected levels of End-User experience and Customer satisfaction. Please, scroll down for Detailed Reports and Charts provided by WebSitePulse: Daily Response Times 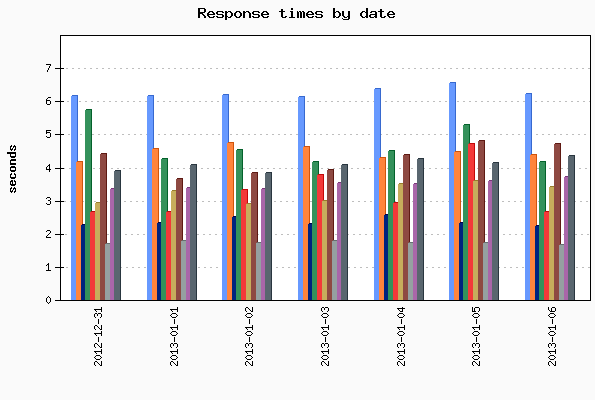
Average Response Times for January 06, 2013
Average Response Times November 21, 2012 - January 06, 2013
Hourly Average Response Times Select individual website to display: 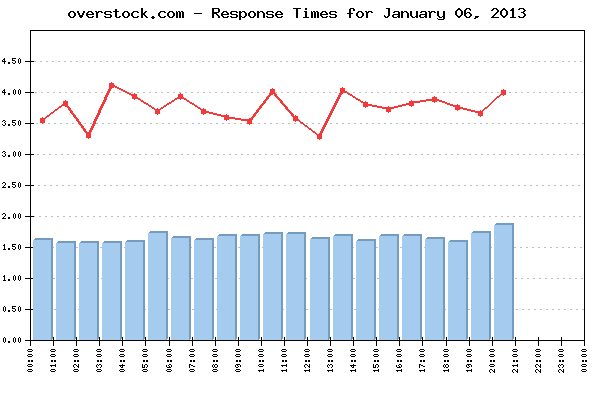 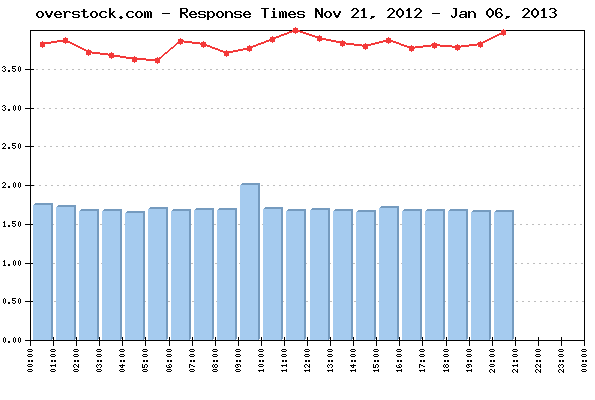
Average response times by hour for January 06, 2013
Average response times by hour November 21, 2012 - January 06, 2013
Uptime Uptime January 06, 2013
Uptime November 21, 2012 - January 06, 2013
Methodology: The 2012 Holiday Season Reports reflect a complete web transaction, representative for the End Users' interactions with a website. The reporting period covers the dates between November 21, 2012 and January 6, 2013. Performance and availability measurements are made for a typical multi-step web transaction at 15 minute monitoring interval, every day 24/7. The WebSitePulse application monitoring service is used to collect data and to create the reports. The steps in each transaction are comparable for all websites, and reflect the real online shopper experience. The simultaneous monitoring is performed from 3 US-based locations of the WebSitePulse monitoring network: Los Angeles, CA, Chicago, IL, and Washington, DC. In case of a detected malfunction or unavailability, the system performs automated error verification from 3 independent resources and only after the above procedure is performed and has returned consistent results, the detected error is confirmed, recorded, and included in the daily performance reports. In these cases, an advanced WebSitePulse exclusive feature comes into play - Forced Monitoring -, which automatically switches to a 3 minute monitoring interval for increased accuracy. About WebSitePulse: WebSitePulse is a leading provider of global, independent, and objective availability and performance monitoring of web sites, servers, network components, web applications, e-business- and email round-trip transactions. Contact: For more information about this report please contact: George T., CTO phone: 1-407-380-1600 email: Reproduction: WebSitePulse launched the Performance and Uptime Reports program to keep the general public and the Internet community informed about the performance of specific websites and the challenges their webmasters, owners and operators are facing on a daily basis, especially when the web traffic intensifies due to some special events through the year. Some of the most popular web destinations, related to each particular event, are selected for the purpose of the Reports, and data from their performance measurements is made available on the WebSitePulse public website. With the intention to broadly disseminate this information for the benefit of the Internet community, we encourage the use of this information without prior approval and under the following Terms and Conditions:
The Data from the performance measurements cannot be changed or manipulated and should be used "as is". | ||||||||||||||||||||||||||||||||||||||||||||||||||||||||||||||||||||||||||||||||||||||||||||||||||||||||||||||||||||||||||||||||||||||||||||||||||||||||||||||||||||||||||||||||||||||||||||||||||||||||||||||||||||||||||||||||||||||||||||||||||||||||||||||||||||||||||||||||||||||||||||||||||||||||||||||||||||||||||||||||||||||||||||||||||||||||||||||||||||||||||||||||||||||||||||||||||||||||||||||||||||||||||||||||||||||||||||||||||||||||||||||||||||||||||||||||||||||||||||||||||||||||||||||||||||||||||||||||||||||||||||||||||||||||||||||||||||||||||||||||||||||||||||||||||||||||||||||||||||||||||||||||||||||||||||||||||||||||||||||||||||||||||||||||||||||||||||||||||||||||||||||||||||||||||||||||||||||||||||||||||||||||||||||||||||||||||||||||||||||||||||||||||||||||||||||||||||||||||||||||||||||||||||||||||||||||||||||||||||||||||||||||||||||||||||||||||||||||||||||||||||||||||||||||||||||||