20 April, 2024
Performance Tracking > 2015 Holiday Season WebSitePulse 2015 Holiday Retail Performance and Uptime ReportHoliday Season is just around the corner and FedEx is predicting “a record-breaking holiday season, forecasting shipments between Black Friday and Christmas Eve will jump about 12% from last year,” according to http://fortune.com/. 12% increase in shipments mean that FedEx is expecting to move about 317 million shipments during that period. In addition, “Many forecasters are forecasting a 3.5%-4% overall increase in total holiday sales, a deceleration from last year’s 5.2% growth. But the e-commerce segment remains a hot growth area as more shoppers move online for their holiday shopping needs. E-commerce sales are forecast to rise between 6% to 8% in 2015, hitting as much as $105 billion, the National Retail Federation has estimated,” Fortune.com also noted. As usual, we have decided to monitor 11 of the most popular websites for shopping online. Considering the forecasts above, however, we must note that such an increase in e- commerce may turn horribly wrong for some of these websites if they are not prepared to bear the heavy traffic load. In other words, the heavy traffic may cause the website to slow down or to crash which then may lead to a number of lost customers. Thus, keeping your website up and running at all times is of utmost importance. We will be publishing daily reports of each of the monitored websites in the period between November 24th , 2015 and January 4th, 2016, so stay tuned.
WebSitePulse reports the following results from web performance measurement of the websites participating in the the Holiday Retail Performance and Uptime Report: The daily Average Response time from all monitored websites was 2.889 sec.
The typical shopping transaction took the least time for kmart.com visitors - 0.948 sec., while the visitors of amazon.com had to be the most patient, as the shopping transaction there took in average of 5.386 sec. Five of the monitored websites delivered above-the-average response times for their transactions, while six of them demonstrated below-the-average daily performance. The daily Average Uptime for the entire Group was 100%. All websites were available with no interruptions. Report Highlights No events of particular importance or possible negative impact on the online visitors' interaction with the Websites included into the 2015 Holiday Season report were detected during the reported period, and according to WebSitePulse, the Group delivered the expected levels of End-User experience and Customer satisfaction. Please, scroll down for Detailed Reports and Charts provided by WebSitePulse: Daily Response Times 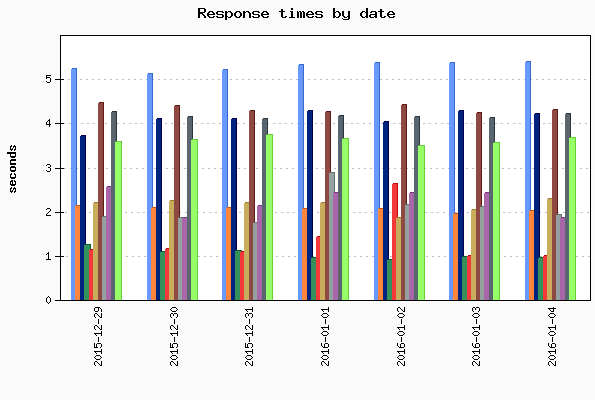
Average Response Times for January 04, 2016
Average Response Times November 23, 2015 - January 04, 2016
Hourly Average Response Times Select individual website to display: 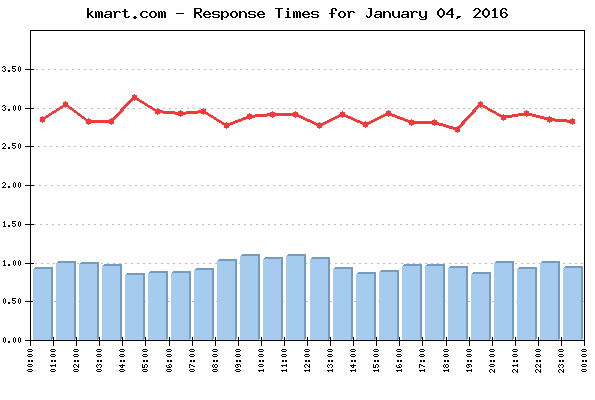 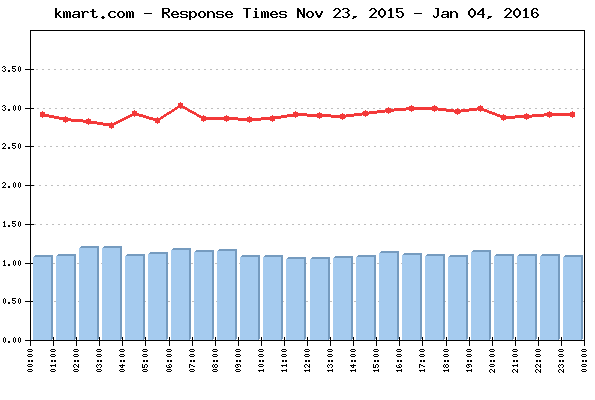
Average response times by hour for January 04, 2016
Average response times by hour November 23, 2015 - January 04, 2016
Uptime Uptime January 04, 2016
Uptime November 23, 2015 - January 04, 2016
Methodology: The 2015 Holiday Season Reports reflect a complete web transaction, representative for the End Users' interactions with a website. The reporting period covers the dates between November 24, 2015 and January 4, 2016. Performance and availability measurements are made for a typical multi-step web transaction at 15 minute monitoring interval, every day 24/7. The WebSitePulse application monitoring service is used to collect data and to create the reports. The steps in each transaction are comparable for all websites, and reflect the real online shopper experience. The simultaneous monitoring is performed from 3 US-based locations of the WebSitePulse monitoring network: Los Angeles, CA, Chicago, IL, and Washington, DC. In case of a detected malfunction or unavailability, the system performs automated error verification from 3 independent resources and only after the above procedure is performed and has returned consistent results, the detected error is confirmed, recorded, and included in the daily performance reports. In these cases, an advanced WebSitePulse exclusive feature comes into play - Forced Monitoring -, which automatically switches to a 3 minute monitoring interval for increased accuracy. About WebSitePulse: WebSitePulse is a leading provider of global, independent, and objective availability and performance monitoring of web sites, servers, network components, web applications, e-business- and email round-trip transactions. Contact: For more information about this report please contact: George T., CTO phone: 1-407-380-1600 email: Reproduction: WebSitePulse launched the Performance and Uptime Reports program to keep the general public and the Internet community informed about the performance of specific websites and the challenges their webmasters, owners and operators are facing on a daily basis, especially when the web traffic intensifies due to some special events through the year. Some of the most popular web destinations, related to each particular event, are selected for the purpose of the Reports, and data from their performance measurements is made available on the WebSitePulse public website. With the intention to broadly disseminate this information for the benefit of the Internet community, we encourage the use of this information without prior approval and under the following Terms and Conditions:
The Data from the performance measurements cannot be changed or manipulated and should be used "as is". | |||||||||||||||||||||||||||||||||||||||||||||||||||||||||||||||||||||||||||||||||||||||||||||||||||||||||||||||||||||||||||||||||||||||||||||||||||||||||||||||||||||||||||||||||||||||||||||||||||||||||||||||||||||||||||||||||||||||||||||||||||||||||||||||||||||||||||||||||||||||||||||||||||||||||||||||||||||||||||||||||||||||||||||||||||||||||||||||||||||||||||||||||||||||||||||||||||||||||||||||||||||||||||||||||||||||||||||||||||||||||||||||||||||||||||||||||||||||||||||||||||||||||||||||||||||||||||||||||||||||||||||||||||||||||||||||||||||||||||||||||||||||||||||||||||||||||||||||||||||||||||||||||||||||||||||||||||||||||||||||||||||||||||||||||||||||||||||||||||||||||||||||||||||||||||||||||||||||||||||||||||||||||||||||||||||||||||||||||||||||||||||||||||||||||||||||||||||||||||||||||||||||||||||||||||||||||||||||||||||||||||||||||||||||||||||||||||||||||||||||||||||||||||||||||||||||||||||||||||||||||||||||||||||||||||||||||||||||||||||||||||||||||||||