25 April, 2024
Performance Tracking > 2013 Holiday Season WebSitePulse 2013 Holiday Retail Performance and Uptime ReportThe 2013 Holiday Season is expected to be tough for retailers this year. In fact, analysts at Morgan Stately predict sales growth will be the weakest since 2008 – only 1.6%, money.cnn.com reported. For comparison, sales in 2012 grew with 3.5%. Experts say sales will be sluggish due to low consumer confidence and despite low gas prices and a rising stock market in the United States. Another factor is that people will have less time for shopping this holiday season, as late Thanksgiving means six fewer days to Christmas than last year, explained Bill Simon, head of Walmart’s US business, for The Financial Times. Retailers, therefore, will be forced to reduce prices drastically in order to attract buyers. This holiday season is even said to bring “the most intense promotional environment since 2008,” according money.cnn.com. Considering that promotions are expected to flood online and walk-in stores this year, we are led to believe that some of the most popular online stores will reach such high online visitors’ traffic that they may not even be able to handle it without any outages. Out of pure curiosity and the belief that websites should be well-prepared to bear heavy traffic load, we decided to monitor 10 of the most popular websites during the whole holiday season – from Nov 21st, 2013 until Jan 6th, 2014. We will be closely watching their availability and performance, and report their statistics on a daily basis. As always, slow websites or such that experience availability interruptions during transactions will cause nothing but revenue losses and disappointed customers who would likely seek the products and services of their online competitors.
WebSitePulse reports the following results from web performance measurement of the websites participating in the the Holiday Retail Performance and Uptime Report: The daily Average Response time from all monitored websites was 3.92 sec.
The typical shopping transaction took the least time for target.com visitors - 2.370 sec., while the visitors of amazon.com had to be the most patient, as the shopping transaction there took in average of 6.557 sec. Four of the monitored websites delivered above-the-average response times for their transactions, while six of them demonstrated below-the-average daily performance. The daily average uptime for the entire Group was 97.45%.
Eight websites were available with no interruptions - 100%. Nine websites' availability was above the average, while one site dragged the average down with below-the-average availability. Report Highlights No events of particular importance or possible negative impact on the online visitors' interaction with the Websites included into the 2013 Holiday Season report were detected during the reported period, and according to WebSitePulse, the Group delivered the expected levels of End-User experience and Customer satisfaction. Please, scroll down for Detailed Reports and Charts provided by WebSitePulse: Daily Response Times 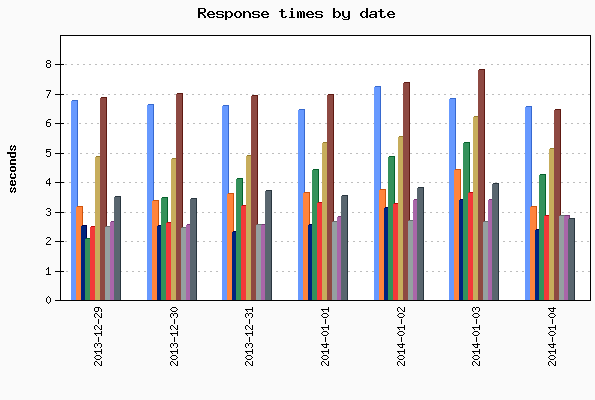
Average Response Times for January 04, 2014
Average Response Times November 21, 2013 - January 04, 2014
Hourly Average Response Times Select individual website to display: 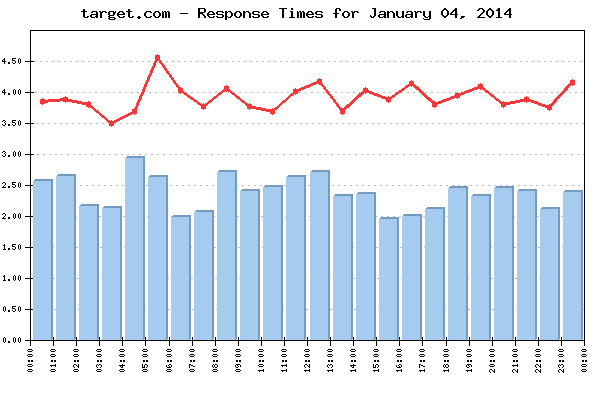 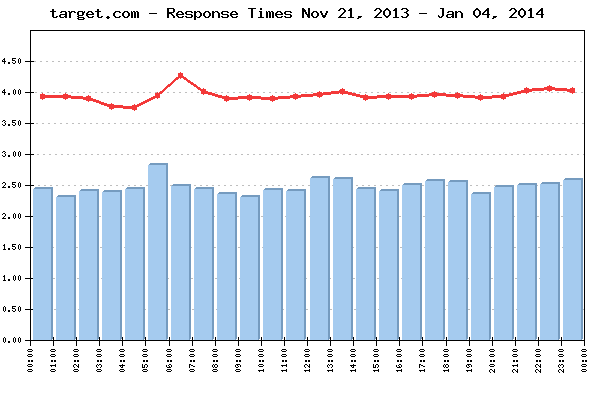
Average response times by hour for January 04, 2014
Average response times by hour November 21, 2013 - January 04, 2014
Uptime Uptime January 04, 2014
Uptime November 21, 2013 - January 04, 2014
Methodology: The 2013 Holiday Season Reports reflect a complete web transaction, representative for the End Users' interactions with a website. The reporting period covers the dates between November 21, 2013 and January 6, 2014. Performance and availability measurements are made for a typical multi-step web transaction at 15 minute monitoring interval, every day 24/7. The WebSitePulse application monitoring service is used to collect data and to create the reports. The steps in each transaction are comparable for all websites, and reflect the real online shopper experience. The simultaneous monitoring is performed from 3 US-based locations of the WebSitePulse monitoring network: Los Angeles, CA, Chicago, IL, and Washington, DC. In case of a detected malfunction or unavailability, the system performs automated error verification from 3 independent resources and only after the above procedure is performed and has returned consistent results, the detected error is confirmed, recorded, and included in the daily performance reports. In these cases, an advanced WebSitePulse exclusive feature comes into play - Forced Monitoring -, which automatically switches to a 3 minute monitoring interval for increased accuracy. About WebSitePulse: WebSitePulse is a leading provider of global, independent, and objective availability and performance monitoring of web sites, servers, network components, web applications, e-business- and email round-trip transactions. Contact: For more information about this report please contact: George T., CTO phone: 1-407-380-1600 email: Reproduction: WebSitePulse launched the Performance and Uptime Reports program to keep the general public and the Internet community informed about the performance of specific websites and the challenges their webmasters, owners and operators are facing on a daily basis, especially when the web traffic intensifies due to some special events through the year. Some of the most popular web destinations, related to each particular event, are selected for the purpose of the Reports, and data from their performance measurements is made available on the WebSitePulse public website. With the intention to broadly disseminate this information for the benefit of the Internet community, we encourage the use of this information without prior approval and under the following Terms and Conditions:
The Data from the performance measurements cannot be changed or manipulated and should be used "as is". | ||||||||||||||||||||||||||||||||||||||||||||||||||||||||||||||||||||||||||||||||||||||||||||||||||||||||||||||||||||||||||||||||||||||||||||||||||||||||||||||||||||||||||||||||||||||||||||||||||||||||||||||||||||||||||||||||||||||||||||||||||||||||||||||||||||||||||||||||||||||||||||||||||||||||||||||||||||||||||||||||||||||||||||||||||||||||||||||||||||||||||||||||||||||||||||||||||||||||||||||||||||||||||||||||||||||||||||||||||||||||||||||||||||||||||||||||||||||||||||||||||||||||||||||||||||||||||||||||||||||||||||||||||||||||||||||||||||||||||||||||||||||||||||||||||||||||||||||||||||||||||||||||||||||||||||||||||||||||||||||||||||||||||||||||||||||||||||||||||||||||||||||||||||||||||||||||||||||||||||||||||||||||||||||||||||||||||||||||||||||||||||||||||||||||||||||||||||||||||||||||||||||||||||||||||||||||||||||||||||||||||||||||||||||||||||||||||||||||||||||||||||||||||||||||||||||||