23 April, 2024
Performance Tracking > 2010 Hurricane Season WebSitePulse 2010 Hurricane Season Web Performance and Uptime ReportWith the Hurricane season approaching, it is cruicial to stay up to date with the current forcasts. In such times, these details can literally be a lifesaver. So, to give our share to the online community, for a sixth year running we will be providing free monitoring and notifications to some of the most popular websites that present their users with real-time forcasts, emergency information and donation opportunities when hurricanes, floods, and other natural or man-caused disasters occur. Traditionally, the Web Performance reports will include data from the measurements of the most visited hurricane and disaster-related websites. The information will be updated and displayed on a daily basis during the most active time of the season - August 1st through October 31,2010. The Reports reflect the most common performance criteria: response time and availability - but in-debt analytical information is also collected and stored in the WebSitePulse system for future references. An RSS feed from the daily Reports is added for more convenience for those interested in the performance of the monitored websites.
WebSitePulse reports the following results from web performance measurement of the Hurricane- and disaster-related websites: The daily Average Response time from all monitored websites was 0.79 sec.
The typical shopping transaction took the least time for nhc.noaa.gov visitors - 0.320 sec., while the visitors of redcross.org had to be the most patient, as the shopping transaction there took in average of 1.330 sec. Two of the monitored websites delivered above-the-average response times for their transactions, while three of them demonstrated below-the-average daily performance. The daily Average Uptime for the entire Group was 100%. All websites were available with no interruptions. Report Highlights No events of particular importance or possible negative impact on the online visitors' interaction with the Websites included into the 2010 Hurricane Season report were detected during the reported period, and according to WebSitePulse, the Group delivered the expected levels of End-User experience and Customer satisfaction. Please, scroll down for Detailed Reports and Charts provided by WebSitePulse: Daily Response Times 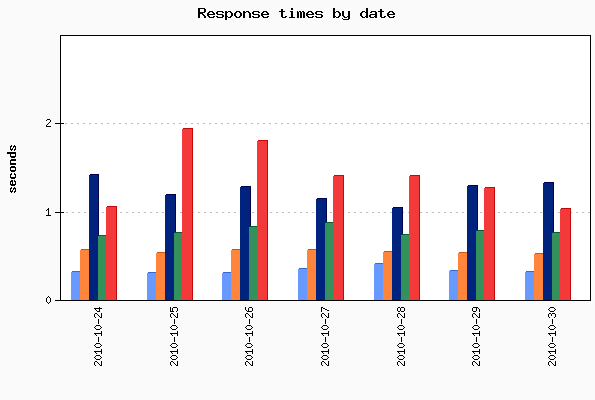
Average Response Times for October 30, 2010
Average Response Times August 01, 2010 - October 30, 2010
Hourly Average Response Times Select individual website to display: 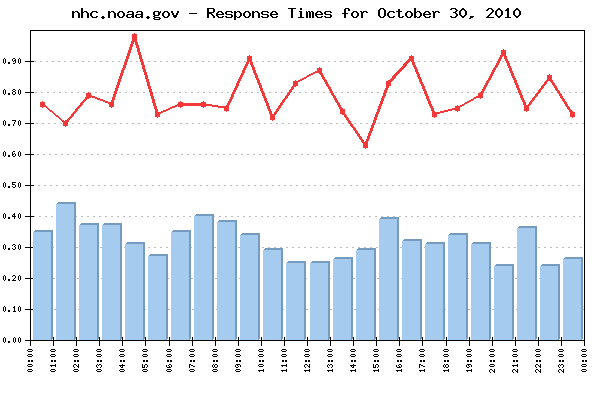 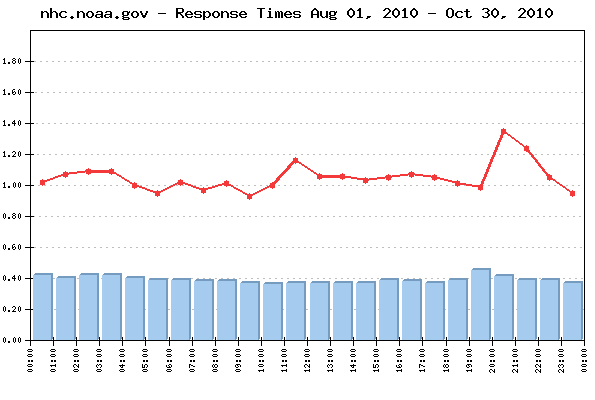
Average response times by hour for October 30, 2010
Average response times by hour August 01, 2010 - October 30, 2010
Uptime Uptime October 30, 2010
Uptime August 01, 2010 - October 30, 2010
Methodology: WebSitePulse Performance Reports measure Uptime and Response Time as the most important metrics for the availability and the reliability of any web-based operation. Performance measurement takes place daily, every 15 minutes during the entire Hurricane season. The WebSitePulse website monitoring service is used to collect data and to create the reports. The simultaneous monitoring is performed from 3 US locations of the WebSitePulse monitoring network: Trumbull, CT, San Francisco, CA and Chicago, IL. In case of a detected malfunction or unavailability, the system performs automated error verification from 3 independent resources and only after the above procedure is performed and has returned consistent results, the detected error is confirmed, recorded, and included in the daily performance reports. In these cases, an advanced WebSitePulse exclusive feature comes into play - Forced Monitoring - which automatically switches to a 3 minute - monitoring interval for increased accuracy. About WebSitePulse: WebSitePulse is a leading provider of global, independent, and objective availability and performance monitoring of web sites, servers, network components, web applications, e-business- and email round-trip transactions. Contact: For more information about this report please contact: George T., CTO phone: 1-407-380-1600 email: Reproduction: WebSitePulse launched the Performance and Uptime Reports program to keep the general public and the Internet community informed about the performance of specific websites and the challenges their webmasters, owners and operators are facing on a daily basis, especially when the web traffic intensifies due to some special events through the year. Some of the most popular web destinations, related to each particular event, are selected for the purpose of the Reports, and data from their performance measurements is made available on the WebSitePulse public website. With the intention to broadly disseminate this information for the benefit of the Internet community, we encourage the use of this information without prior approval and under the following Terms and Conditions:
The Data from the performance measurements cannot be changed or manipulated and should be used "as is". | |||||||||||||||||||||||||||||||||||||||||||||||||||||||||||||||||||||||||||||||||||||||||||||||||||||||||||||||||||||||||||||||||||||||||||||||||||||||||||||||||||||||||||||||||||||||||||||||||||||||||||||||||||||||||||||||||||||||||||||||||||||||||||||||||||||||||||||||||||||||||||||||||||||||||||||||||||||||||||||||||||||||||||||||||||||||||||||||||||||||||||||||||||||||||||||||||||||||||||||||||||||||||||||||||||||||||||||||||||||||||||||||||||||||||||||||||||||||||||||||||||||||||||||||||||||||||||||||||||||||||||