07 July, 2026
Performance Tracking > 2008 Holiday Season WebSitePulse 2008 Holiday Retail Performance and Uptime ReportThe Holidays are the most important time of the year for the online retailers. BDO Seidman, LLP, one of the leading accounting and consulting organizations in USA, predicted that the “Black Friday,” which is the official starting day of the holiday season shopping, is going to observe a sales growth of 1.2%. During "Cyber Monday", the following Monday after "Black Friday", sales is expected to grow by 2.4%. The organization published its latest edition of "The BDO Seidman Retail Compass Survey". One of the biggest surveys in USA, the survey was conducted upon 100 chief marketing officers from leading retail stores around the country. Market Watch reports: "While it is good to see growth, unfortunately this is down significantly from last year, when reports found that actual Black Friday and Cyber Monday sales grew 8.3 and 21 percent respectively," said Ted Vaughan, a Partner in the Retail and Consumer Product Practice at BDO Seidman. "While seemingly dismal this year, it is important to remember that there are some bright spots on the horizon. There is still enormous growth potential in internet sales, which remains a fairly new phenomenon. Further, gift cards will be popular this year because they allow the end user to decide on the gift based on their personal needs." WebSitePulse is monitoring ten of the most popular online shopping destinations for the 2008 Holiday Season. The Reports reflect a typical online purchase transaction, like selecting an item, adding it to the shopping cart and checkout, representative for the End Users' interactions with a website. Measurements of the multi-step transactions are made every 15 minutes, simultaneously from 3 different US cities. The reporting period covers the dates between November 24, 2008 and January 5, 2009.
WebSitePulse reports the following results from web performance measurement of the websites participating in the the Holiday Retail Performance and Uptime Report: The daily Average Response time from all monitored websites was 4.473 sec.
The typical shopping transaction took the least time for sears.com visitors - 1.815 sec., while the visitors of bestbuy.com had to be the most patient, as the shopping transaction there took in average of 15.689 sec. Three of the monitored websites delivered above-the-average response times for their transactions, while seven of them demonstrated below-the-average daily performance. The daily average uptime for the entire Group was 99.48%.
Eight websites were available with no interruptions - 100%. Eight websites' availability was above the average, while two sites dragged the average down with below-the-average availability. Report Highlights No events of particular importance or possible negative impact on the online visitors' interaction with the Websites included into the 2008 Holiday Season report were detected during the reported period, and according to WebSitePulse, the Group delivered the expected levels of End-User experience and Customer satisfaction. Please, scroll down for Detailed Reports and Charts provided by WebSitePulse: Daily Response Times 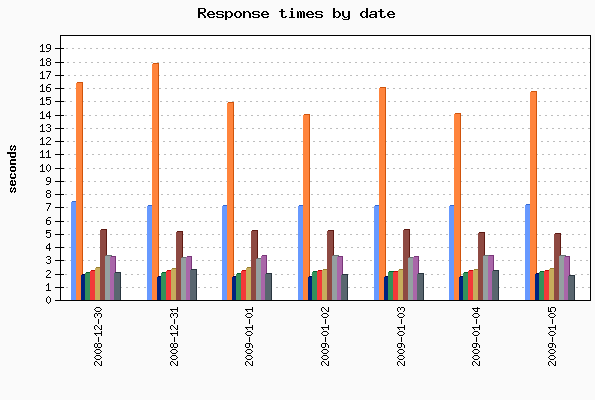
Average Response Times for January 05, 2009
Average Response Times November 24, 2008 - January 05, 2009
Hourly Average Response Times Select individual website to display: 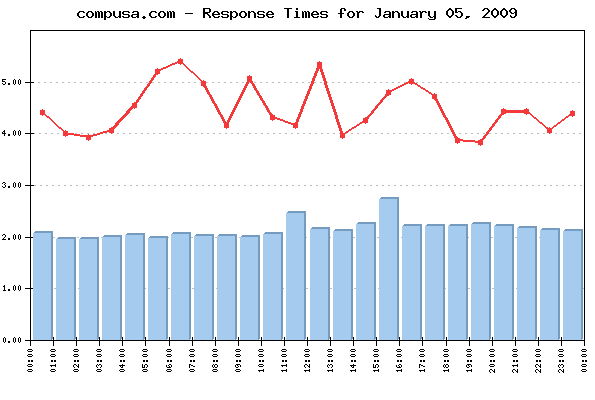 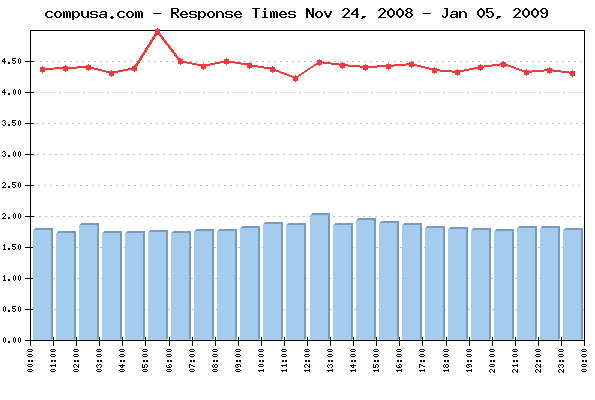
Average response times by hour for January 05, 2009
Average response times by hour November 24, 2008 - January 05, 2009
Uptime Uptime January 05, 2009
Uptime November 24, 2008 - January 05, 2009
Methodology: The 2008 Holiday Season Reports reflect a complete web transaction, representative for the End Users' interactions with a website. The reporting period covers the dates between November 24, 2008 and January 5, 2009. Performance and availability measurements are made for a typical multi-step web transaction at 15 minute monitoring interval, every day 24/7. The WebSitePulse application monitoring service is used to collect data and to create the reports. The steps in each transaction are comparable for all websites, and reflect the real online shopper experience. The simultaneous monitoring is performed from 3 US-based locations of the WebSitePulse monitoring network: Los Angeles, CA, Chicago, IL, and Washington, DC. In case of a detected malfunction or unavailability, the system performs automated error verification from 3 independent resources and only after the above procedure is performed and has returned consistent results, the detected error is confirmed, recorded, and included in the daily performance reports. In these cases, an advanced WebSitePulse exclusive feature comes into play - Forced Monitoring -, which automatically switches to a 3 minute monitoring interval for increased accuracy. About WebSitePulse: WebSitePulse is a leading provider of global, independent, and objective availability and performance monitoring of web sites, servers, network components, web applications, e-business- and email round-trip transactions. Contact: For more information about this report please contact: George T., CTO phone: 1-407-380-1600 email: Reproduction: WebSitePulse launched the Performance and Uptime Reports program to keep the general public and the Internet community informed about the performance of specific websites and the challenges their webmasters, owners and operators are facing on a daily basis, especially when the web traffic intensifies due to some special events through the year. Some of the most popular web destinations, related to each particular event, are selected for the purpose of the Reports, and data from their performance measurements is made available on the WebSitePulse public website. With the intention to broadly disseminate this information for the benefit of the Internet community, we encourage the use of this information without prior approval and under the following Terms and Conditions:
The Data from the performance measurements cannot be changed or manipulated and should be used "as is". | ||||||||||||||||||||||||||||||||||||||||||||||||||||||||||||||||||||||||||||||||||||||||||||||||||||||||||||||||||||||||||||||||||||||||||||||||||||||||||||||||||||||||||||||||||||||||||||||||||||||||||||||||||||||||||||||||||||||||||||||||||||||||||||||||||||||||||||||||||||||||||||||||||||||||||||||||||||||||||||||||||||||||||||||||||||||||||||||||||||||||||||||||||||||||||||||||||||||||||||||||||||||||||||||||||||||||||||||||||||||||||||||||||||||||||||||||||||||||||||||||||||||||||||||||||||||||||||||||||||||||||||||||||||||||||||||||||||||||||||||||||||||||||||||||||||||||||||||||||||||||||||||||||||||||||||||||||||||||||||||||||||||||||||||||||||||||||||||||||||||||||||||||||||||||||||||||||||||||||||||||||||||||||||||||||||||||||||||||||||||||||||||||||||||||||||||||||||||||||||||||||||||||||||||||||||||||||||||||||||||||||||||||||||||||||||||||||||||||||||||||||||||||||||||||||||||||