* We recomment to Accept all Cookies. Required cookies are essential for the basic operations and functionality of the website, enabling core features such as user logins, account management and dashboard settings. These cookies do not track personal analytics data or enable additional features like Live Chat support sessions.
According to Forrester Research, in 2007, nearly 40 million US households will book travel online, spending $86 billion on airline tickets, lodging, cars, intercity rail, cruises, and packages. Up-selling will be a major goal of product strategy, Web site redesigns, kiosk launches, and mobile marketing will be used to justify implementing online customer service applications like click-to-chat and click-to-callback.
We believe that the most popular vacation planning and booking websites will have to respond to increased web traffic during the summer travel booking period. We have selected twelve popular travel websites from US, Europe and Australia that rank at the highest search engine positions. We will monitor these sites continuously from May 16 through June 30, 2007 and measure the performance levels and the availability of these websites independently and from various remote worldwide monitoring locations to best reflect the End Users' experience.
Continuous monitoring for all websites covers the period May 16 through June 30, 2007. The reports and charts are updated daily showing the results from the previous day and for the entire monitoring period to the current date.
Daily Report for June 30, 2007
See report for:
WebSitePulse reports the following results from web performance measurement of the leading international summer vacation planning and booking websites:
The daily Average Response time from all monitored websites was 7.198 sec.
The Average Response time as measured from the US East Coast (Washington, DC) was:
4.779 sec.
The Average Response time as measured from the US West Coast (San Francisco, CA) was:
6.041 sec.
The Average Response time as measured from Europe(Amsterdam, Netherlands) was:
7.259 sec.
The Average Response time as measured from Australia (Sydney, NSW) was:
10.713 sec.
The Best Response time measured from the US East Coast was:
1.623 sec.
The Best Response time measured from the US West Coast was:
1.159 sec.
The Best Response time measured from Europe was:
1.548 sec.
The Best Response time measured from Australia was:
1.506 sec.
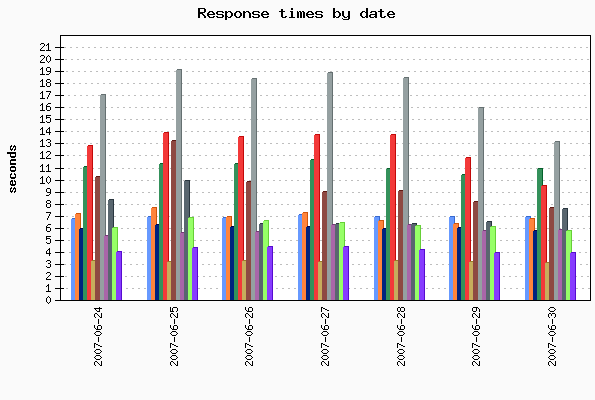
The typical transaction loading took the least time for expedia.com visitors - 3.081 sec., while the visitors of orbitz.com had to be the most patient, as the loading there took in average of 13.082 sec. Five of the monitored websites delivered above-the-average response times for their shopping transaction, while seven of them demonstrated below-the-average daily performance.
The daily average uptime for the entire Group was 98.94%.
The Average Uptime as measured from the US East Coast (Washington, DC) was:
98.98%
The Average Uptime as measured from the US West Coast (San Francisco, CA) was:
99.04%
The Average Uptime as measured from Europe (Amsterdam, Netherlands) was:
98.88%
The Average Uptime as measured from Australia (Sydney, NSW) was:
98.86%
Six websites were available with no interruptions - 100%. Ten websites' availability was above the average, while two sites dragged the average down with below-the-average availability.
Report Highlights
Orbitz.com and CheapTickets.com performed site maintenance early in the morning. The downtime lasted from 3am to 4:30am EST.
Please, scroll down for Detailed Reports and Charts provided by WebSitePulse:
Daily Response Times
Legend:
wotif
travel.yahoo
booking
bookit
cheaptickets
expedia
hotels
orbitz
priceline
travelnow
travelocity
venere
Average Response Times for June 30, 2007
#
Target
San Francisco
Amsterdam
Washington
Sydney
Avg. resp. time
1
expedia.com
1.159
3.866
1.623
5.677
3.081
2
venere.com
4.629
1.548
2.778
6.564
3.880
3
booking.com
6.504
1.772
3.573
11.056
5.726
4
travelocity.com
4.327
6.250
3.956
8.524
5.764
5
priceline.com
4.611
5.144
2.337
11.137
5.807
6
travel.yahoo.com
5.903
7.473
2.500
10.914
6.698
7
wotif.com
6.536
11.272
8.196
1.506
6.878
8
travelnow.com
6.107
8.981
5.288
9.736
7.528
9
hotels.com
6.282
7.499
6.486
10.211
7.620
10
cheaptickets.com
7.549
8.907
5.856
15.458
9.443
11
bookit.com
9.210
11.237
6.888
16.151
10.872
12
orbitz.com
9.676
13.157
7.869
21.626
13.082
Average Response Times May 16, 2007 - June 30, 2007
#
Target
San Francisco
Amsterdam
Washington
Sydney
Avg. resp. time
1
expedia.com
1.304
4.518
1.583
5.878
3.321
2
venere.com
5.177
2.592
2.415
6.764
4.237
3
booking.com
6.399
1.817
3.746
11.355
5.829
4
priceline.com
4.692
5.327
2.468
10.865
5.838
5
travelocity.com
4.752
6.837
4.497
9.045
6.283
6
travel.yahoo.com
4.464
7.282
2.744
11.413
6.476
7
wotif.com
7.450
11.533
8.382
1.600
7.241
8
travelnow.com
5.853
8.479
5.099
9.804
7.309
9
hotels.com
10.099
11.315
8.916
12.942
10.818
10
bookit.com
9.672
9.783
6.000
18.283
10.935
11
cheaptickets.com
10.821
12.653
9.430
18.787
12.923
12
orbitz.com
14.063
16.913
12.263
25.573
17.203
Hourly Average Response Times Select individual website to display:
Legend:
individual site response times
monitored group average response times
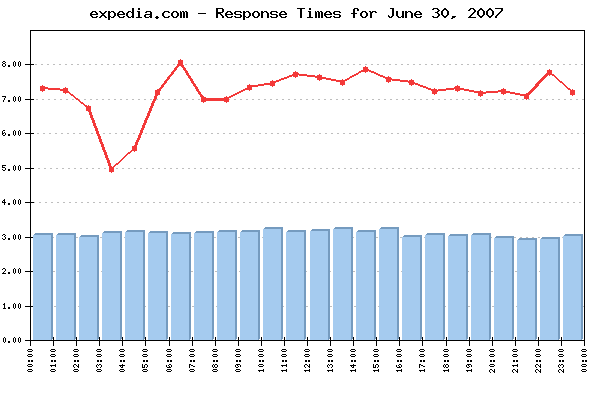
Average response times by hour for June 30, 2007
Target
Hours
00
01
02
03
04
05
06
07
08
09
10
11
12
13
14
15
16
17
18
19
20
21
22
23
booking
5.49
5.40
5.60
6.11
5.79
5.47
5.60
5.53
5.58
5.70
5.72
5.80
5.74
5.86
5.69
5.86
5.96
5.98
5.88
5.79
5.77
5.76
5.76
5.59
bookit
11.11
10.08
9.50
9.34
9.34
11.09
14.47
10.07
9.17
9.31
10.95
11.47
10.97
11.76
11.99
14.04
10.71
10.31
11.34
9.86
10.58
8.83
14.51
10.12
cheaptickets
10.53
9.98
10.28
0.56
3.33
8.02
9.70
8.25
8.43
9.17
10.84
12.21
12.18
11.05
10.23
9.74
10.29
9.72
10.48
9.62
11.22
9.72
10.51
10.54
expedia
3.05
3.04
2.98
3.11
3.13
3.12
3.08
3.10
3.15
3.14
3.23
3.15
3.17
3.21
3.13
3.22
3.00
3.05
3.02
3.04
2.96
2.91
2.94
3.02
hotels
7.23
6.28
6.39
6.76
7.61
8.07
7.50
7.30
7.36
7.42
7.02
7.37
7.61
8.14
7.97
8.67
9.65
8.75
6.81
7.78
8.72
8.23
6.66
7.57
orbitz
14.65
15.20
13.53
0.55
4.28
11.47
17.47
14.76
12.19
13.65
16.35
15.58
14.84
13.44
14.52
12.82
12.76
14.70
13.53
13.46
13.07
14.29
13.52
13.36
priceline
5.48
5.86
5.56
5.58
5.63
5.47
5.35
5.55
6.20
6.47
6.15
6.13
5.90
5.97
6.12
5.59
5.65
5.72
5.68
6.09
5.86
5.98
5.57
5.83
travel.yahoo
7.44
8.26
6.06
5.43
5.67
10.07
8.69
5.23
7.83
7.43
5.29
7.60
6.81
6.08
7.12
5.24
6.54
5.28
6.77
6.76
5.09
7.40
6.77
5.89
travelnow
6.22
6.09
5.02
5.91
5.84
6.57
8.50
8.36
8.15
9.12
7.58
7.67
8.09
8.41
9.28
9.69
8.78
7.01
7.60
7.33
6.72
6.37
8.59
7.79
travelocity
5.42
5.33
5.45
5.44
5.37
6.51
5.44
5.56
5.82
6.14
5.98
5.46
5.65
5.68
6.04
5.76
5.83
5.96
6.11
5.77
5.88
5.59
6.32
5.84
venere
3.72
4.53
3.44
4.17
3.34
3.82
4.04
3.47
3.81
3.85
3.60
3.60
3.92
3.41
5.85
3.56
4.11
3.64
3.58
3.62
4.11
3.14
4.98
3.82
wotif
7.40
6.92
7.07
6.69
7.33
6.82
7.02
6.85
6.36
6.83
6.94
6.59
6.90
6.84
6.67
6.61
6.76
6.71
7.04
6.85
6.95
6.57
7.33
6.99
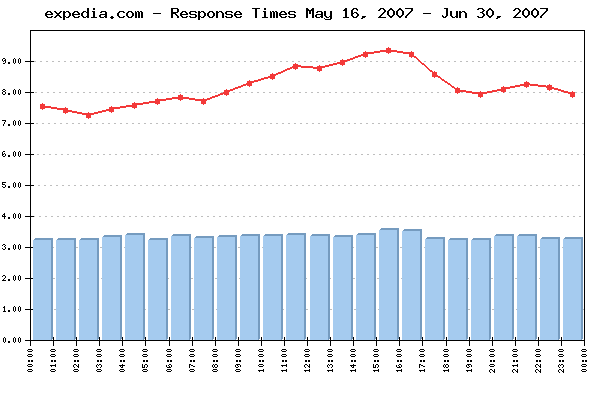
Average response times by hour May 16, 2007 - June 30, 2007
Target
Hours
00
01
02
03
04
05
06
07
08
09
10
11
12
13
14
15
16
17
18
19
20
21
22
23
booking
5.55
5.59
5.60
5.74
5.74
5.88
5.63
5.41
5.48
5.65
5.77
5.85
5.99
5.92
6.00
6.00
6.00
6.05
6.01
5.97
6.04
6.19
6.07
5.77
bookit
10.42
10.20
9.76
10.15
9.73
9.96
10.04
10.06
10.18
10.37
10.64
11.35
11.12
10.98
11.17
11.58
11.16
12.04
11.75
11.57
12.43
12.23
12.23
11.25
cheaptickets
12.09
11.43
10.82
10.80
10.86
11.03
11.49
11.15
11.69
12.80
13.20
14.32
14.52
14.64
14.89
15.13
14.36
13.65
13.23
13.12
13.51
13.98
13.82
13.59
expedia
3.21
3.21
3.23
3.31
3.38
3.24
3.34
3.29
3.31
3.34
3.36
3.38
3.37
3.32
3.38
3.56
3.51
3.25
3.22
3.22
3.34
3.36
3.26
3.25
hotels
7.27
7.31
7.52
8.83
9.36
11.00
11.30
11.76
12.75
12.97
13.05
13.04
12.52
13.42
15.43
17.13
17.29
11.35
8.31
7.69
7.47
7.84
7.33
7.40
orbitz
16.27
15.82
14.46
14.42
14.93
15.03
15.71
15.40
15.74
16.62
17.73
18.95
19.32
19.26
19.76
19.45
19.09
18.57
17.61
17.28
17.39
18.21
17.99
17.73
priceline
5.81
5.54
5.70
5.46
5.86
5.60
5.60
5.54
5.82
5.87
5.93
5.82
5.88
6.26
6.37
5.92
5.84
5.79
5.67
5.68
6.16
6.21
5.98
5.78
travel.yahoo
6.46
6.33
6.35
6.22
6.25
6.32
6.52
5.99
6.46
6.67
6.48
6.79
6.59
6.82
6.87
6.50
6.72
6.47
6.33
6.48
6.48
6.57
6.40
6.46
travelnow
6.41
6.51
6.77
7.26
7.19
7.29
7.17
7.16
7.48
7.76
7.72
7.76
7.70
7.85
7.85
8.49
8.67
7.90
7.06
6.64
6.77
6.84
6.60
6.63
travelocity
5.99
5.85
5.81
5.72
5.70
5.70
5.74
5.66
5.84
5.97
6.29
6.58
6.81
7.01
6.86
6.77
6.75
6.55
6.38
6.34
6.37
6.67
6.90
6.40
venere
4.00
4.01
3.80
4.22
3.93
4.33
4.45
4.14
4.22
4.28
4.78
5.03
4.56
4.94
4.97
4.74
4.16
3.93
3.96
3.94
3.79
3.77
3.81
3.97
wotif
7.10
7.34
7.40
7.42
7.87
7.23
7.13
6.90
6.99
7.11
7.07
7.14
6.96
7.15
6.99
7.11
7.34
7.37
7.41
7.45
7.40
7.28
7.48
7.14
Uptime
Uptime June 30, 2007
#
Target
San Francisco
Amsterdam
Washington
Sydney
Avg. uptime
1
hotels.com
100.000%
100.000%
100.000%
100.000%
100.000%
2
travelnow.com
100.000%
100.000%
100.000%
100.000%
100.000%
3
venere.com
100.000%
100.000%
100.000%
100.000%
100.000%
4
wotif.com
100.000%
100.000%
100.000%
100.000%
100.000%
5
expedia.com
100.000%
100.000%
100.000%
100.000%
100.000%
6
booking.com
100.000%
100.000%
100.000%
100.000%
100.000%
7
priceline.com
100.000%
100.000%
100.000%
99.770%
99.943%
8
travelocity.com
100.000%
100.000%
100.000%
99.740%
99.935%
9
travel.yahoo.com
100.000%
100.000%
100.000%
99.730%
99.933%
10
bookit.com
99.720%
99.040%
99.340%
99.480%
99.395%
11
orbitz.com
94.660%
93.850%
94.570%
93.600%
94.170%
12
cheaptickets.com
94.120%
93.650%
93.910%
94.050%
93.933%
Uptime May 16, 2007 - June 30, 2007
#
Target
San Francisco
Amsterdam
Washington
Sydney
Avg. uptime
1
booking.com
100.000%
99.980%
99.995%
99.962%
99.984%
2
travel.yahoo.com
99.993%
99.995%
99.995%
99.935%
99.980%
3
travelocity.com
100.000%
100.000%
99.995%
99.843%
99.960%
4
venere.com
99.880%
99.952%
99.996%
99.920%
99.937%
5
expedia.com
99.913%
99.951%
99.939%
99.898%
99.925%
6
wotif.com
99.890%
99.876%
99.897%
99.873%
99.884%
7
travelnow.com
99.895%
99.876%
99.852%
99.787%
99.852%
8
priceline.com
99.754%
99.700%
99.766%
99.596%
99.704%
9
cheaptickets.com
99.542%
99.665%
99.680%
99.593%
99.620%
10
hotels.com
99.473%
99.599%
99.620%
99.615%
99.577%
11
orbitz.com
98.974%
99.024%
99.148%
99.011%
99.039%
12
bookit.com
98.218%
98.159%
98.366%
98.153%
98.224%
Methodology:
Performance and availability are measured for a typical travel-related booking web transaction at 15 minute monitoring interval, every day, 24/7. The WebSitePulse application monitoring service is used to collect data and to create the reports.
The steps in each transaction are comparable for all websites, and reflect the real online buyers' experience. The simultaneous monitoring is performed from four locations of the WebSitePulse global monitoring network: San Francisco, CA; Washington, DC; Sydney, Australia, and Amsterdam, Netherlands. In case of a detected malfunction or unavailability, the system performs automated error verification from four independent resources and only after the above procedure is performed and has returned consistent results, the detected error is confirmed, recorded, and included in the daily performance reports. In these cases, an advanced WebSitePulse exclusive feature comes into play - Forced Monitoring -, which automatically switches to a 3 minute monitoring interval for increased accuracy.
About WebSitePulse:
WebSitePulse is a leading provider of global, independent, and objective availability and performance monitoring of web sites, servers, network components, web applications, e-business- and email round-trip transactions.
Contact:
For more information about this report please contact:
George T., CTO
phone: 1-407-380-1600
email:
Reproduction:
WebSitePulse launched the Performance and Uptime Reports program to keep the general public and the Internet community informed about the performance of specific websites and the challenges their webmasters, owners and operators are facing on a daily basis, especially when the web traffic intensifies due to some special events through the year. Some of the most popular web destinations, related to each particular event, are selected for the purpose of the Reports, and data from their performance measurements is made available on the WebSitePulse public website.
With the intention to broadly disseminate this information for the benefit of the Internet community, we encourage the use of this information without prior approval and under the following Terms and Conditions:
WebSitePulse should be referred as the "Source" of the information;
WebSitePulse should be acknowledged as the owner of the copyrights of the information in the Reports;
The texts of the Reports could be changed or altered to better suit the needs and the style of the publisher without prior notice to WebSitePulse. However, the integrity and the meaning of the information should be preserved;
The Data from the performance measurements cannot be changed or manipulated and should be used "as is".