
Performance Tracking > 2019 Valentine's Day
WebSitePulse reports the following results from web performance measurement of the websites participating in the the Holiday Retail Performance and Uptime Report:
The daily Average Response time from all monitored websites was 2.92 sec.
The typical shopping transaction took the least time for helzberg.com visitors - 1.694 sec., while the visitors of ftd.com had to be the most patient, as the shopping transaction there took in average of 5.026 sec.
Three of the monitored websites delivered above-the-average response times for their transactions, while four of them demonstrated below-the-average daily performance.
The daily average uptime for the entire Group was 99.75%.
Six websites were available with no interruptions - 100%.
Six websites' availability was above the average, while one site dragged the average down with below-the-average availability.
Report Highlights
No events of particular importance or possible negative impact on the online visitors' interaction with the Websites included into the 2019 Valentine's day report were detected during the reported period, and according to WebSitePulse, the Group delivered the expected levels of End-User experience and Customer satisfaction.
Please, scroll down for Detailed Reports and Charts provided by WebSitePulse:
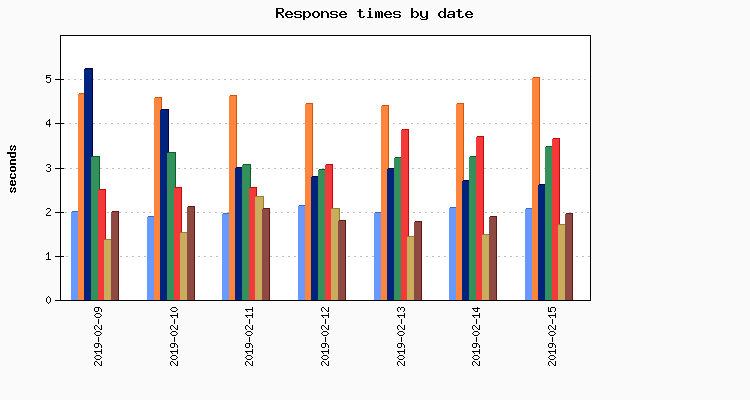
Daily Response Times
Average Response Times for February 15, 2019
Average Response Times February 01, 2019 - February 15, 2019
Hourly Average Response Times
Select individual website to display:
Average response times by hour for February 15, 2019
Average response times by hour February 01, 2019 - February 15, 2019
Uptime
Uptime February 15, 2019
Uptime February 01, 2019 - February 15, 2019
Methodology:
The 2019 Valentine's Day Reports reflect a complete fullpage web transaction, representative for the End Users' interactions with a website. The reporting period covers the dates between February 1st and February 15th, 2019. Performance and availability measurements are made for a typical multi-step web transaction at 15 minute monitoring interval, every day 24/7. The WebSitePulse application monitoring service is used to collect data and to create the reports.
The steps in each transaction are comparable for all websites, and reflect the real online shopper experience. The simultaneous monitoring is performed from 3 US-based locations of the WebSitePulse monitoring network: San Francisco, CA, Chicago, IL, and Washington, DC. In case of a detected malfunction or unavailability, the system performs automated error verification from 3 independent resources and only after the above procedure is performed and has returned consistent results, the detected error is confirmed, recorded, and included in the daily performance reports. In these cases, an advanced WebSitePulse exclusive feature comes into play - Forced Monitoring -, which automatically switches to a 3 minute monitoring interval for increased accuracy.
About WebSitePulse:
WebSitePulse is a leading provider of global, independent, and objective availability and performance monitoring of web sites, servers, network components, web applications, e-business- and email round-trip transactions.
Contact:
For more information about this report please contact:
George T., CTO
phone: 1-407-380-1600
email:
Reproduction:
WebSitePulse launched the Performance and Uptime Reports program to keep the general public and the Internet community informed about the performance of specific websites and the challenges their webmasters, owners and operators are facing on a daily basis, especially when the web traffic intensifies due to some special events through the year. Some of the most popular web destinations, related to each particular event, are selected for the purpose of the Reports, and data from their performance measurements is made available on the WebSitePulse public website.
With the intention to broadly disseminate this information for the benefit of the Internet community, we encourage the use of this information without prior approval and under the following Terms and Conditions:
The Data from the performance measurements cannot be changed or manipulated and should be used "as is".
WebSitePulse 2019 Valentine's Day Online Retail Performance and Uptime Report
The hype from 2019 Holiday Season is now over, just to make room for the next holiday when lots of
people will spend big money—St. Valentine’s Day.
Saint Valentine's Day is celebrated annually on February 14 and it is associated with romance and romantic love. A huge amount of money is being spent on the day usually for romantic dinner and flowers. However, before the exact day even greater amount of money is being spent on gifts and presents for the loved ones.
In 2019, nearly 55% of the Americans celebrated Valentine’s Day and were expected to spend $19.6 billion (according to the National Retail Federation) with an average of $143.56 per person and 29% of the surveyed planned to buy their gifts online.
With nearly $6 billion to be spent online for St. Valentine’s Day 2019, heavy traffic is expected to all online gift shops. The competition will be fierce and only the most prepared online stores will gain bigger pieces of the pie.
For the 12 th year in a row, WebSitePulse will monitor 7 of the most popular gift websites. This Performance Reports will measure the websites’ uptime and response time as the most important metrics for the availability and the reliability of any web store.
Measurements of web transactions will be made every 15 minutes, simultaneously from 3 different monitoring locations.
In-depth analytical information is also collected and stored in the WebSitePulse system for future references.
| Daily Report for February 15, 2019 | See report for: |
WebSitePulse reports the following results from web performance measurement of the websites participating in the the Holiday Retail Performance and Uptime Report:
The daily Average Response time from all monitored websites was 2.92 sec.
| The Average Response time as measured from the US East Coast (Washington DC) was: | 2.725 sec. |
| The Average Response time as measured from the US West Coast (San Francisco, CA) was: | 3.387 sec. |
| The Average Response time as measured from the US Central was (Chicago, IL): | 2.649 sec. |
| The Best Response time measured from US East Coast (Washington DC): | 1.330 sec. |
| The Best Response time measured from US West Coast (San Francisco, CA): | 2.156 sec. |
| The Best Response time measured from US Central was (Chicago, IL): | 1.406 sec. |
The typical shopping transaction took the least time for helzberg.com visitors - 1.694 sec., while the visitors of ftd.com had to be the most patient, as the shopping transaction there took in average of 5.026 sec.
Three of the monitored websites delivered above-the-average response times for their transactions, while four of them demonstrated below-the-average daily performance.
The daily average uptime for the entire Group was 99.75%.
| The Average Uptime as measured from the US East Coast (Washington DC) was: | 99.74% |
| The Average Uptime as measured from the US West Coast (San Francisco, CA) was: | 99.73% |
| The Average Uptime as measured from the US Central (Chicago, IL): | 99.77% |
Six websites were available with no interruptions - 100%.
Six websites' availability was above the average, while one site dragged the average down with below-the-average availability.
Report Highlights
No events of particular importance or possible negative impact on the online visitors' interaction with the Websites included into the 2019 Valentine's day report were detected during the reported period, and according to WebSitePulse, the Group delivered the expected levels of End-User experience and Customer satisfaction.
Please, scroll down for Detailed Reports and Charts provided by WebSitePulse:
Daily Response Times
| Legend: | ||||
| brookstone | ftd | vermonteddybear | 1800flowers | harryanddavid |
| helzberg | pagoda | |||
Average Response Times for February 15, 2019
| # | Target | San Francisco | Chicago | Washington | Avg. resp. time |
|---|---|---|---|---|---|
| 1 | helzberg.com | 2.156 | 1.470 | 1.456 | 1.694 |
| 2 | pagoda.com | 3.080 | 1.406 | 1.330 | 1.939 |
| 3 | brookstone.com | 2.568 | 2.017 | 1.588 | 2.058 |
| 4 | vermonteddybear.com | 2.816 | 2.402 | 2.579 | 2.599 |
| 5 | 1800flowers.com | 4.026 | 3.071 | 3.326 | 3.474 |
| 6 | harryanddavid.com | 4.310 | 3.325 | 3.320 | 3.652 |
| 7 | ftd.com | 4.752 | 4.854 | 5.473 | 5.026 |
Average Response Times February 01, 2019 - February 15, 2019
| # | Target | San Francisco | Chicago | Washington | Avg. resp. time |
|---|---|---|---|---|---|
| 1 | helzberg.com | 1.509 | 1.537 | 1.589 | 1.545 |
| 2 | pagoda.com | 2.680 | 1.594 | 1.400 | 1.891 |
| 3 | brookstone.com | 2.307 | 2.041 | 1.721 | 2.023 |
| 4 | harryanddavid.com | 3.112 | 2.637 | 2.742 | 2.830 |
| 5 | 1800flowers.com | 3.708 | 3.155 | 3.171 | 3.344 |
| 6 | vermonteddybear.com | 4.910 | 3.864 | 4.136 | 4.303 |
| 7 | ftd.com | 4.632 | 4.909 | 5.184 | 4.908 |
Hourly Average Response Times
Select individual website to display:
| Legend: | |
| individual site response times | monitored group average response times |
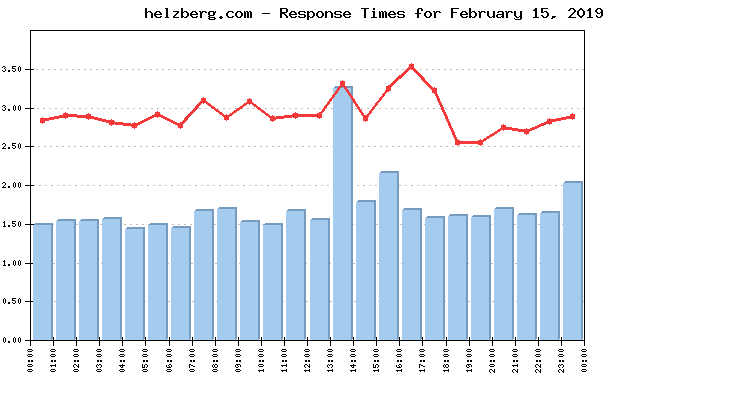
Average response times by hour for February 15, 2019
| Target | Hours | |||||||||||||||||||||||
| 00 | 01 | 02 | 03 | 04 | 05 | 06 | 07 | 08 | 09 | 10 | 11 | 12 | 13 | 14 | 15 | 16 | 17 | 18 | 19 | 20 | 21 | 22 | 23 | |
| 1800flowers | 3.20 | 3.56 | 3.18 | 3.67 | 3.70 | 3.96 | 3.39 | 3.73 | 3.26 | 3.80 | 3.20 | 2.99 | 3.70 | 3.45 | 3.19 | 3.46 | 3.48 | 3.37 | 3.36 | 3.57 | 3.73 | 3.33 | 3.63 | 3.47 |
| brookstone | 2.16 | 2.10 | 1.95 | 1.86 | 2.31 | 2.20 | 1.62 | 2.29 | 1.60 | 2.73 | 1.73 | 2.00 | 2.01 | 2.43 | 2.18 | 2.12 | 1.41 | 2.56 | 2.03 | 1.96 | 1.92 | 2.30 | 1.86 | 2.05 |
| ftd | 4.31 | 4.60 | 4.47 | 4.54 | 4.14 | 4.70 | 4.55 | 5.41 | 4.51 | 4.38 | 4.58 | 4.55 | 4.92 | 5.19 | 5.09 | 5.74 | 10.22 | 6.78 | 4.18 | 4.30 | 4.32 | 4.48 | 5.13 | 5.52 |
| harryanddavid | 4.18 | 4.40 | 4.63 | 3.82 | 3.96 | 4.17 | 4.56 | 4.18 | 4.22 | 3.55 | 4.49 | 4.13 | 4.01 | 3.62 | 3.90 | 3.48 | 3.05 | 3.03 | 2.63 | 2.78 | 2.80 | 2.58 | 2.69 | 2.77 |
| helzberg | 1.48 | 1.54 | 1.53 | 1.56 | 1.43 | 1.49 | 1.45 | 1.67 | 1.69 | 1.52 | 1.49 | 1.66 | 1.55 | 3.25 | 1.78 | 2.16 | 1.68 | 1.57 | 1.60 | 1.59 | 1.69 | 1.61 | 1.64 | 2.02 |
| pagoda | 1.96 | 1.70 | 2.33 | 1.98 | 1.67 | 1.91 | 1.42 | 2.25 | 1.44 | 2.26 | 1.84 | 2.26 | 1.61 | 1.95 | 1.39 | 2.80 | 1.91 | 2.30 | 1.95 | 1.41 | 2.10 | 2.26 | 2.45 | 1.37 |
| vermonteddybear | 2.59 | 2.43 | 2.14 | 2.22 | 2.23 | 1.94 | 2.40 | 2.17 | 3.47 | 3.37 | 2.77 | 2.68 | 2.49 | 3.32 | 2.55 | 2.95 | 2.92 | 2.94 | 2.13 | 2.19 | 2.69 | 2.37 | 2.35 | 3.07 |
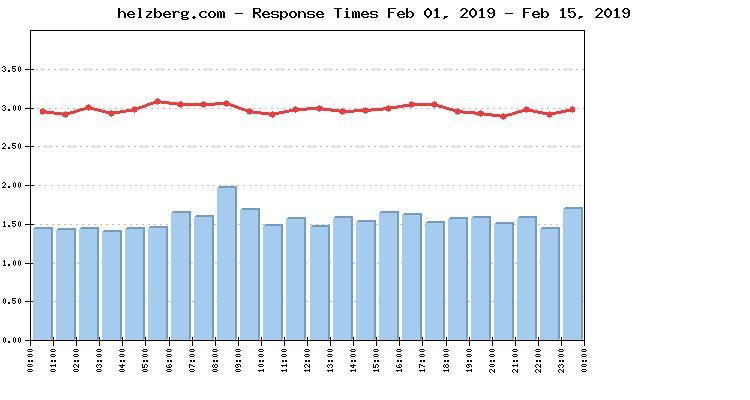
Average response times by hour February 01, 2019 - February 15, 2019
| Target | Hours | |||||||||||||||||||||||
| 00 | 01 | 02 | 03 | 04 | 05 | 06 | 07 | 08 | 09 | 10 | 11 | 12 | 13 | 14 | 15 | 16 | 17 | 18 | 19 | 20 | 21 | 22 | 23 | |
| 1800flowers | 3.26 | 3.32 | 3.47 | 3.45 | 3.53 | 3.55 | 3.62 | 3.62 | 3.42 | 3.28 | 3.25 | 3.22 | 3.35 | 3.22 | 3.30 | 3.30 | 3.23 | 3.28 | 3.22 | 3.30 | 3.17 | 3.25 | 3.28 | 3.38 |
| brookstone | 1.99 | 1.99 | 1.94 | 1.86 | 2.00 | 2.27 | 1.89 | 1.94 | 1.86 | 2.04 | 2.13 | 2.18 | 2.11 | 2.02 | 2.10 | 1.91 | 1.88 | 2.13 | 2.03 | 2.07 | 2.11 | 2.18 | 1.88 | 2.05 |
| ftd | 4.94 | 4.83 | 4.99 | 4.80 | 4.77 | 5.07 | 4.94 | 5.04 | 4.75 | 4.63 | 4.63 | 4.83 | 4.90 | 4.91 | 4.76 | 4.85 | 5.34 | 4.96 | 4.87 | 4.97 | 4.79 | 5.03 | 5.18 | 5.01 |
| harryanddavid | 2.90 | 2.84 | 3.13 | 2.92 | 2.95 | 3.02 | 2.97 | 2.89 | 2.87 | 2.78 | 2.83 | 2.79 | 2.76 | 2.77 | 2.75 | 2.74 | 2.79 | 2.89 | 2.72 | 2.71 | 2.77 | 2.75 | 2.70 | 2.70 |
| helzberg | 1.43 | 1.42 | 1.43 | 1.39 | 1.43 | 1.45 | 1.64 | 1.59 | 1.96 | 1.68 | 1.47 | 1.56 | 1.46 | 1.57 | 1.52 | 1.64 | 1.61 | 1.51 | 1.56 | 1.57 | 1.50 | 1.57 | 1.43 | 1.69 |
| pagoda | 1.85 | 1.58 | 1.87 | 1.85 | 1.86 | 1.84 | 1.93 | 1.97 | 1.96 | 2.03 | 1.93 | 1.91 | 1.83 | 1.90 | 1.88 | 2.06 | 2.08 | 2.03 | 1.97 | 1.73 | 1.84 | 1.87 | 1.84 | 1.77 |
| vermonteddybear | 4.30 | 4.42 | 4.22 | 4.23 | 4.29 | 4.33 | 4.32 | 4.27 | 4.58 | 4.22 | 4.20 | 4.36 | 4.53 | 4.35 | 4.47 | 4.39 | 4.32 | 4.54 | 4.27 | 4.17 | 4.02 | 4.19 | 4.08 | 4.23 |
Uptime
Uptime February 15, 2019
| # | Target | San Francisco | Chicago | Washington | Avg. uptime |
|---|---|---|---|---|---|
| 1 | helzberg.com | 100.000% | 100.000% | 100.000% | 100.000% |
| 2 | pagoda.com | 100.000% | 100.000% | 100.000% | 100.000% |
| 3 | harryanddavid.com | 100.000% | 100.000% | 100.000% | 100.000% |
| 4 | 1800flowers.com | 100.000% | 100.000% | 100.000% | 100.000% |
| 5 | brookstone.com | 100.000% | 100.000% | 100.000% | 100.000% |
| 6 | vermonteddybear.com | 100.000% | 100.000% | 100.000% | 100.000% |
| 7 | ftd.com | 98.110% | 98.360% | 98.170% | 98.213% |
Uptime February 01, 2019 - February 15, 2019
| # | Target | San Francisco | Chicago | Washington | Avg. uptime |
|---|---|---|---|---|---|
| 1 | harryanddavid.com | 100.000% | 100.000% | 100.000% | 100.000% |
| 2 | helzberg.com | 100.000% | 100.000% | 100.000% | 100.000% |
| 3 | 1800flowers.com | 100.000% | 100.000% | 100.000% | 100.000% |
| 4 | brookstone.com | 100.000% | 100.000% | 99.987% | 99.996% |
| 5 | pagoda.com | 99.895% | 99.949% | 99.908% | 99.917% |
| 6 | ftd.com | 99.874% | 99.891% | 99.878% | 99.881% |
| 7 | vermonteddybear.com | 99.843% | 99.855% | 99.859% | 99.852% |
Methodology:
The 2019 Valentine's Day Reports reflect a complete fullpage web transaction, representative for the End Users' interactions with a website. The reporting period covers the dates between February 1st and February 15th, 2019. Performance and availability measurements are made for a typical multi-step web transaction at 15 minute monitoring interval, every day 24/7. The WebSitePulse application monitoring service is used to collect data and to create the reports.
The steps in each transaction are comparable for all websites, and reflect the real online shopper experience. The simultaneous monitoring is performed from 3 US-based locations of the WebSitePulse monitoring network: San Francisco, CA, Chicago, IL, and Washington, DC. In case of a detected malfunction or unavailability, the system performs automated error verification from 3 independent resources and only after the above procedure is performed and has returned consistent results, the detected error is confirmed, recorded, and included in the daily performance reports. In these cases, an advanced WebSitePulse exclusive feature comes into play - Forced Monitoring -, which automatically switches to a 3 minute monitoring interval for increased accuracy.
About WebSitePulse:
WebSitePulse is a leading provider of global, independent, and objective availability and performance monitoring of web sites, servers, network components, web applications, e-business- and email round-trip transactions.
Contact:
For more information about this report please contact:
George T., CTO
phone: 1-407-380-1600
email:
Reproduction:
WebSitePulse launched the Performance and Uptime Reports program to keep the general public and the Internet community informed about the performance of specific websites and the challenges their webmasters, owners and operators are facing on a daily basis, especially when the web traffic intensifies due to some special events through the year. Some of the most popular web destinations, related to each particular event, are selected for the purpose of the Reports, and data from their performance measurements is made available on the WebSitePulse public website.
With the intention to broadly disseminate this information for the benefit of the Internet community, we encourage the use of this information without prior approval and under the following Terms and Conditions:
- WebSitePulse should be referred as the "Source" of the information;
- WebSitePulse should be acknowledged as the owner of the copyrights of the information in the Reports;
- The texts of the Reports could be changed or altered to better suit the needs and the style of the publisher without prior notice to WebSitePulse. However, the integrity and the meaning of the information should be preserved;
The Data from the performance measurements cannot be changed or manipulated and should be used "as is".