If your business largely depends on your website, you may often need to show its uptime to your customers.
As a WebSitePulse client, you have an option called ‘Stats Publisher’where you set up a public report page that includes the uptime statistics for one or more of your targets. The reports are published on www.MyWebReports.net and can be viewed by everyone, or just by the people whom you give access to.
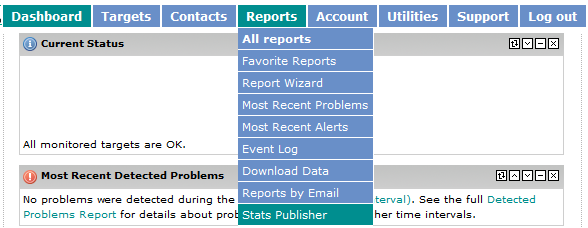
To configure the tool, simply log in your account and go to Reports -> Stats Publisher, as shown below:
The following page will be loaded. Here you can create new individual or summary reports and edit, publish or delete the already existing ones (if any).
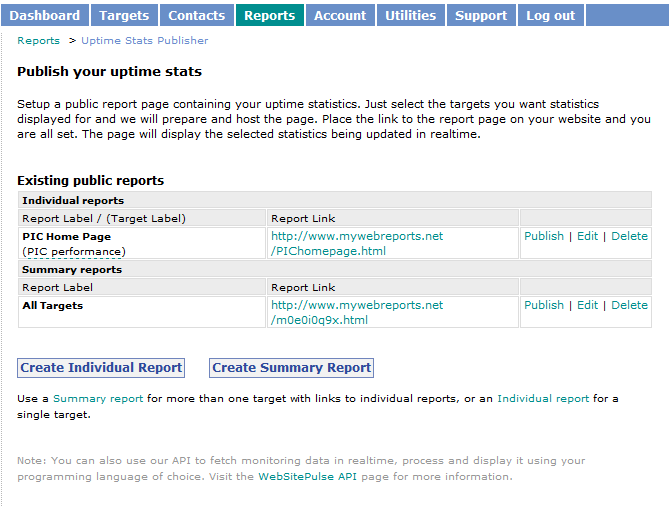
Let’s first start with the difference between the individual and summary reports. The individual report is used to present the uptime data for a single target, as opposed to the summary report, which is used when there is a need to include multiple targets.
Now we will create an individual report. Simply click on the Create Individual Report button and you will be redirected to the following page:
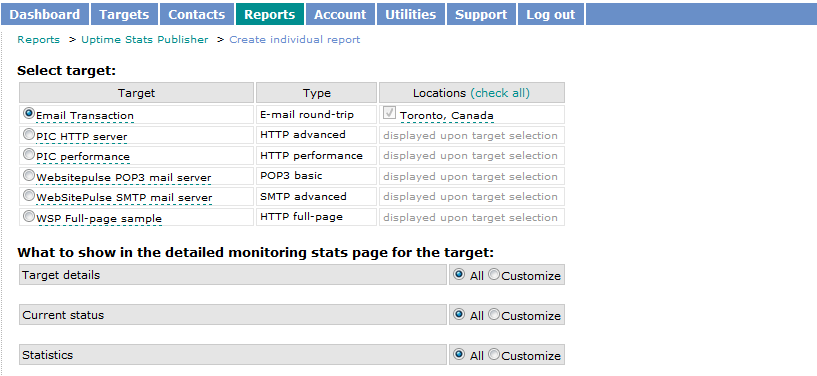
Then you need to select a target from the list and the locations you want to be included in the report. The next step is choosing the detailed monitoring stats that will be shown in the report. If you choose to show all, this is the information that will be included:
Target details:
Target Label
Host address
Target type
Target time zone
Monitoring interval
Monitoring status
Start date
Current status:
Last check time
Last check result
Status duration (days, hours, minutes)
Response time of the last check (ms.)
Check ping data
Show steps details for transactions
Statistics:
Details
- Number of checks
- Uptime %
- Downtime duration
- Number of Failures
- Average response time
- Longest period without errors (days, hours, min)
- Longest period of downtime (days, hours, min)
Show the details above for the following time periods:
- Today
- Last 30 days
- Last 90 days
- Last 180 days
- Target Lifetime
Misc
- Status history
Clicking the Customize radio button will let you include or exclude every single one of the aforementioned components from the public report. The next parameter that is allowed to be configured is the date format and separator. There is a variety of formats to choose from:
mm/dd/yyyy (example 01/21/2007)
dd/mm/yyyy (example 21/01/2007)
yyyy/mm/dd (example 2007/01/21)
mm/dd/yy (example 01/21/07)
dd/mm/yy (example 21/01/07)
yy/mm/dd (example 07/01/21)
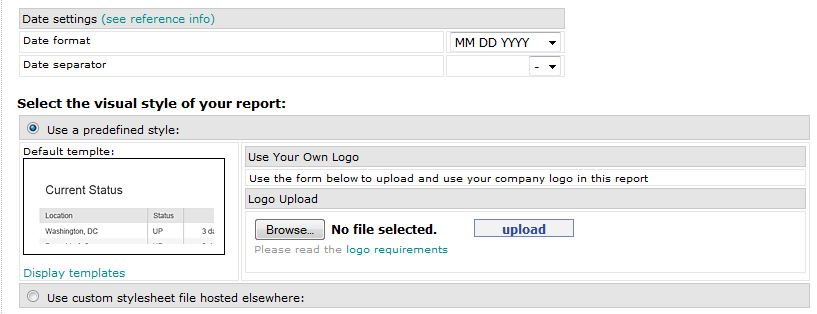
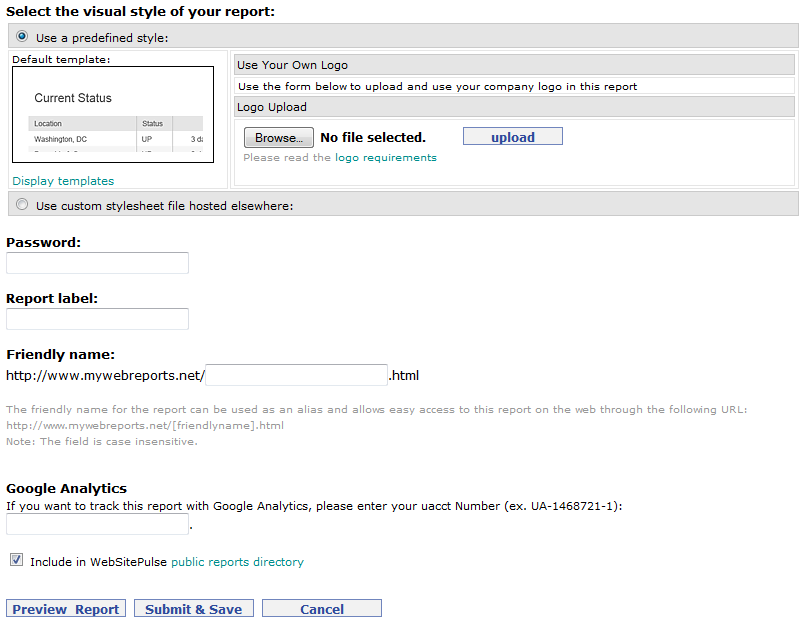
The select the visual style of your report lets you customize your template and upload a logo. You can choose from the following templates:
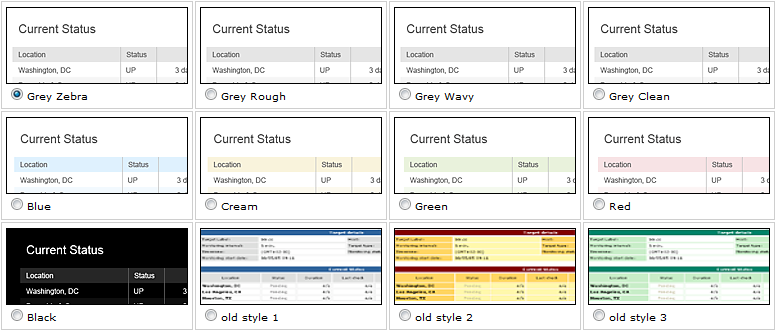
A custom stylesheet can also be uploaded. You can download the default CSS file from here, customize it, upload it on your server and paste the link in the field.
The next step involves choosing a password and a report label. The password field could be left blank.
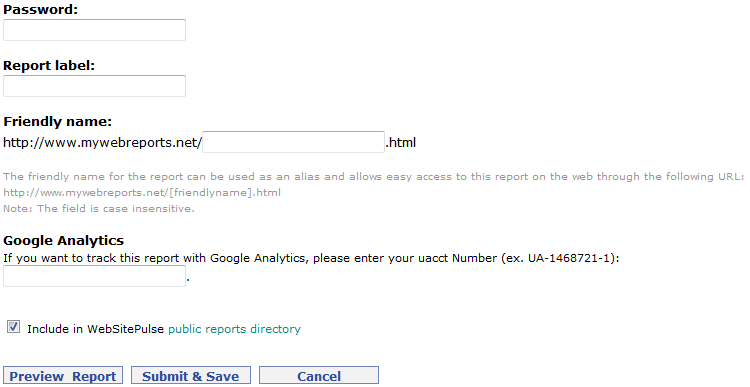
A friendly name for the report can be chosen to make to the report easier to access. The report will be then available on the following page: www.mywebreports.net/[friendlyname].html. If you leave the field blank the URL will be automatically generated.
The report could also be tracked with Google Analytics. The UACCT number has to be entered in the respective field for this feature to work.
You can also choose whether to include your report in our public reports directory or not.
Once you are done configuring the options click the preview report button to see how the report looks like. Submit & Save saves the configuration and publishes the report.
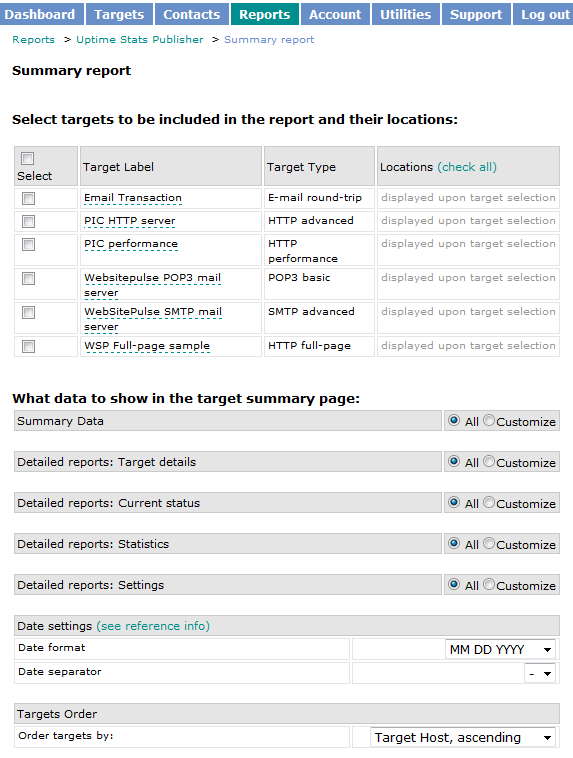
The Summary Report is almost as easy to configure. The only difference is that multiple targets can be chosen to be shown and that they can be ordered in a different way.
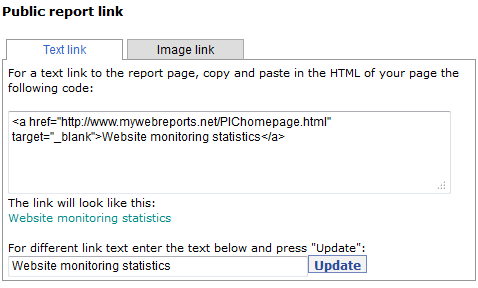
Once the report has been created you can publish, edit or delete it on the main page. Clicking the Publish link will allow you to get a generated HTML code with a link to the report.
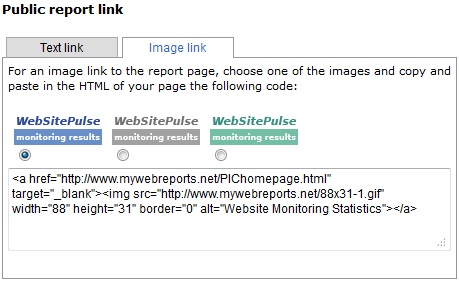
An image link could also be chosen, which will be included in a HTML code that is ready for your page:
Here is an example of how such a report looks like published on our www.mywebreports.net page:
www.mywebreports.net/PIChomepage.html
The stats publisher is a useful tool for those that want to keep their customers informed about the uptime of their website without giving them permissions to their WebSitePulse accounts.


 Copyright 2000-2026, WebSitePulse. All rights reserved.