 If you want to generate a report regarding a specific target and you know the type of data you are looking for, you can use our Report Wizard to get the desired results. Since we have hundreds of different reports, if you are new to the system or you have not used the reports’ section yet, the easiest way to get the data needed is to use the report wizard.
To get to the Report Wizard, go to the Reports section of the control panel. There are basically 4 major types of reports which you can generate:
- Uptime statistics
- Logs and summaries
- Multiple locations reports
- Status History
Depending on the type of data you want to visualize, you have to pick one of these types to start with.
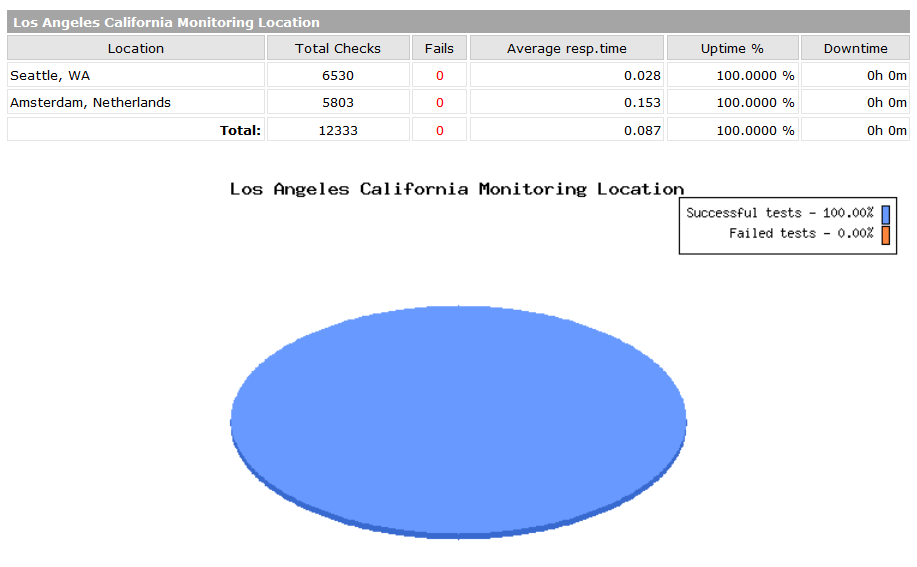
The Uptime Statistics report will provide you with charts and data regarding the total number of checks that were performed for a specific target and the number of failures we detected. Here is a sample report:

You can generate uptime statistics reports that contain a chart, text data or both. You can choose these reports to show the data for a specific location or for all locations used to monitor your target. The report will only show monthly data and you can choose a starting month and an ending month.
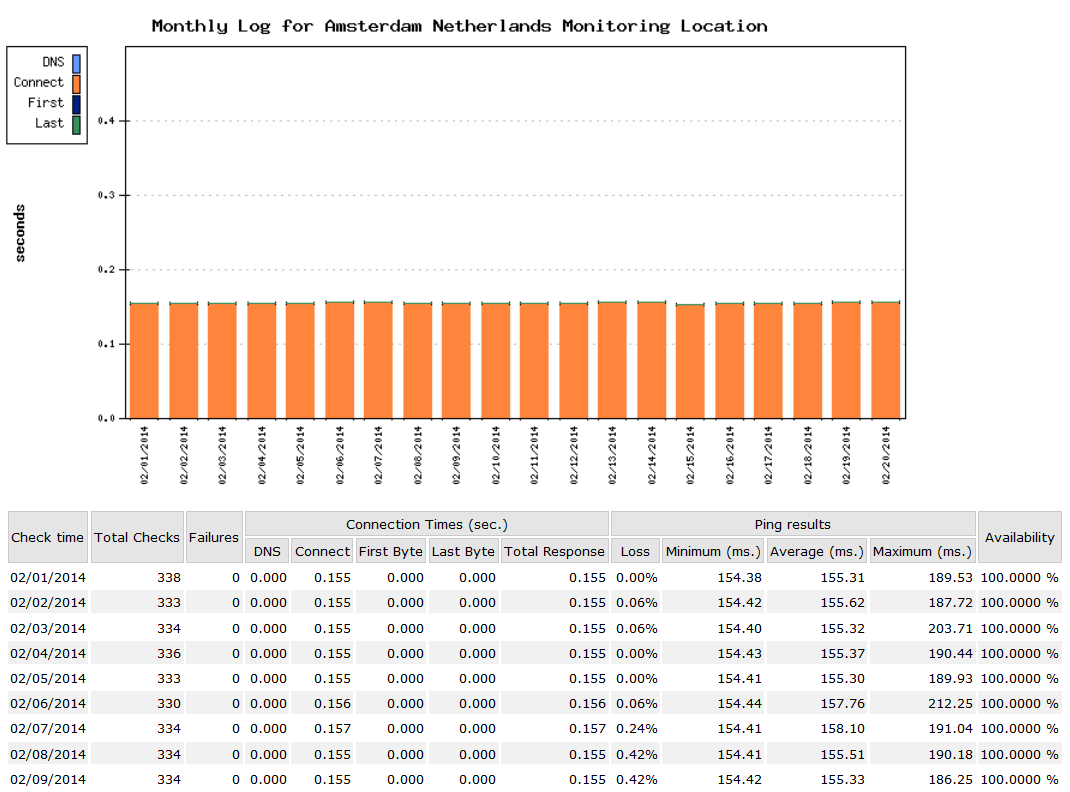
The Logs and Summaries reports look like this:

There are 6 different subtypes of these reports you can choose from. The picture above shows a monthly log (day-by-day) report. You can also choose to generate Daily log, Daily errors report, Daily status summary, Weekly log and Weekly errors report.
Once you select the target you will need to choose from 5 types of visualization:
- Chart
- Text Data
- Text & Data
- Extended Chart
- Extended Chart and Data
Depending on your choice, you can get the information you require in a way that is suitable for your needs.
This report can only be generated for a specific location. You cannot generate this report for all locations (in case you have more than 1 location monitoring a specific target).
Lastly, you will be asked to select a starting date for the report. If you are generating a daily report, you should enter the date you want the report to be generated for.
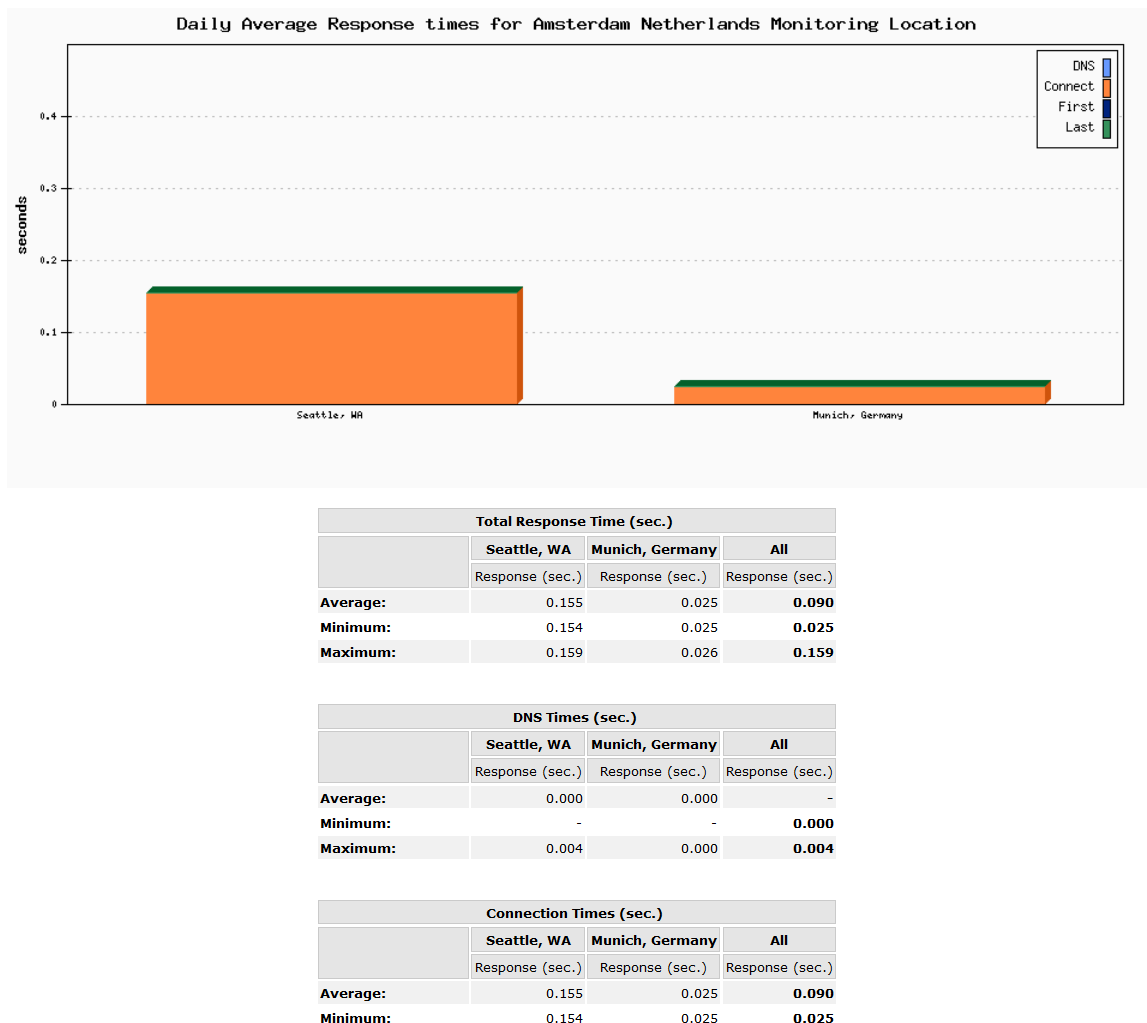
Multiple locations reports look like this:

There are 4 distinctive subtypes you can choose from for the multiple locations reports:
- Average response times (seen in the picture above)
- Hourly response times
- PING Statistics
- Uptime
Once you select the starting day for the report you can choose the period of the report. We allow daily and weekly reports to be generated.
You can also generate Status History reports:

These reports can also only be generated for specific locations. They only show the monthly data but keep in mind that we keep the status history data since the creation of the target, so you can generate such reports for any period as long as the target has been running during those periods.
Once you generate a report at the top left-hand corner, you will find a location drop down menu from which you can change the monitoring location. If you change the location, the report will refresh and show the correct data.
At the bottom of the report, you will find more options.
You will be able to change the starting and ending dates of the reports. In order for those changes to take effect, you will need to press the Generate Report button.
If you want to email the report to yourself or someone else, you can do so by pressing the Email this report button and fill in the details.
Once you generate the report, you want and you need to generate the same report again in the future you can always add that report to your favorites reports by clicking on the add to favorites button. If you go to the favorite reports section after that you will be able to generate the report by simply clicking on a single link.
Don't have account yet? Try our monitoring services for free!


 Copyright 2000-2026, WebSitePulse. All rights reserved.