We have already created a sample transaction and now we will review the reports and settings option for every step of the transaction.
If you click on the Chart icon (play statistics),

you will see the status which your server returned as well as the response time of the step. If you upload the transaction as a full-page target, the response time will increase simply because we do not download all the components of the website when we play the transaction using this specific add-on.
By clicking on the Response Headers tab,
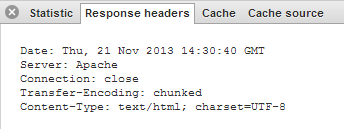
you will see the header which your server returned.
The Cache tab will visualize the specific page for the specific step.
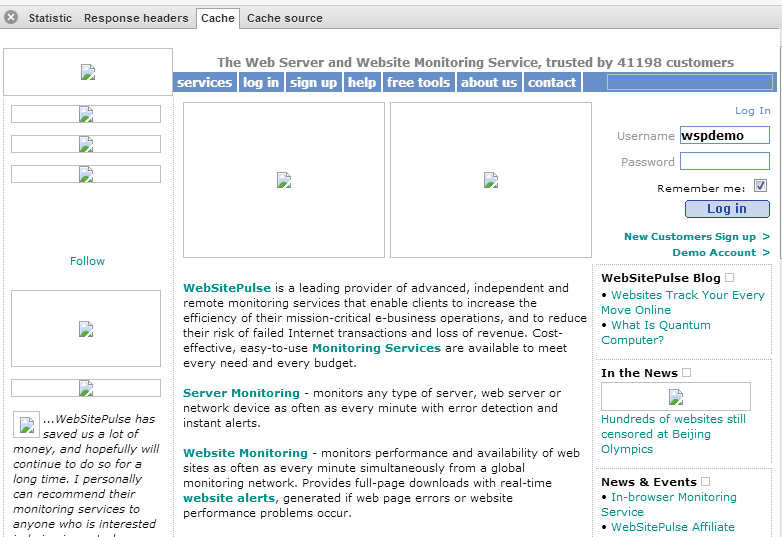
Here, we will not show the pictures and some other components of the website might be missing too. If you decide to use our full-page transaction level of monitoring, all those components can be checked for availability and download speed as well.
And the last tab - Cache source - will show you the HTML source code of the actual page.
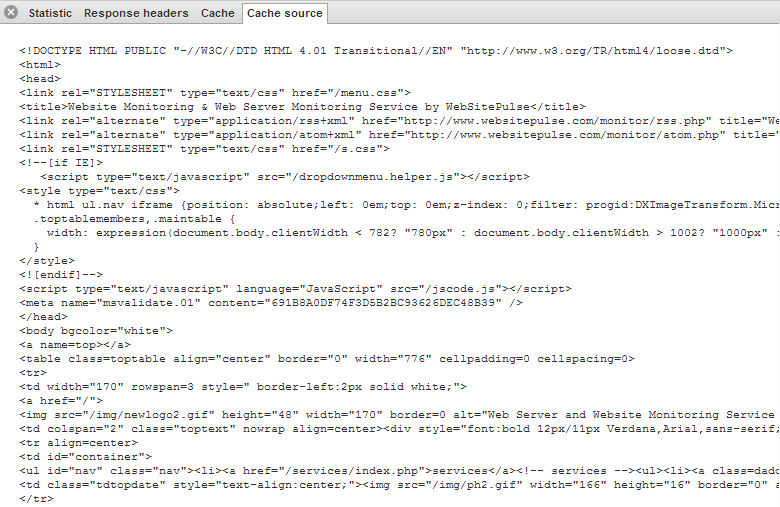
You can check these statistics for every single step of the transaction to make sure that you have recorded the correct steps.
Now, let‘s look at the Step Settings options.
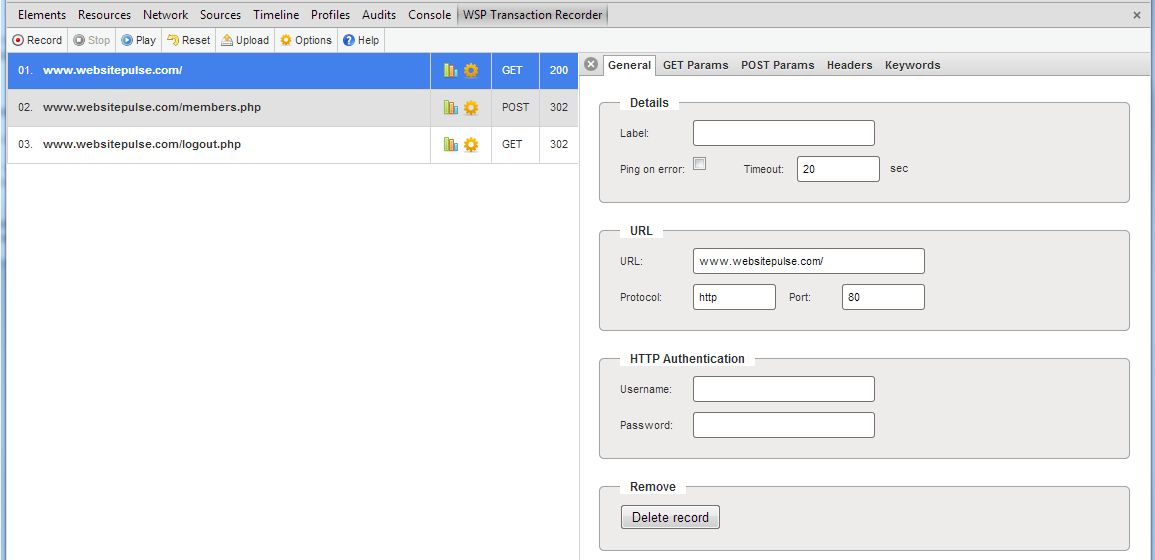
To get here, simply click on the second icon – Step Settings. Here, you can customize the step settings, so you will not have to fine-tune the transaction after you upload it to your account.
In the General tab,
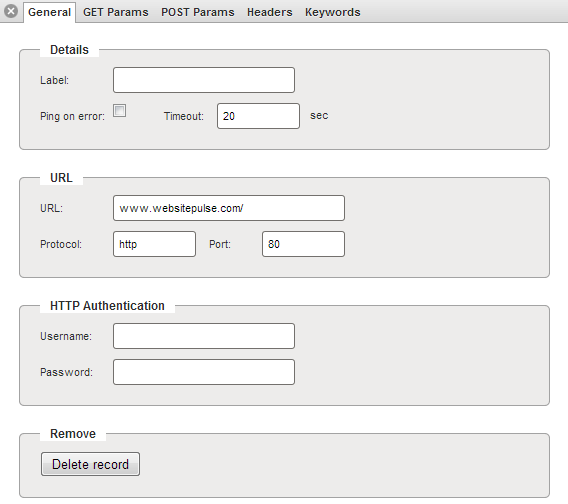
you can enter the Step Label. You can also enable the Ping on error option and set the step timeout value.
In the URL section, you will see the URL which we are opening and the protocol and port which we are using.
If your site requires basic HTTP authentication, you can enter the test username and password in these text fields.
Sometimes, the recorder will record steps that are actually not needed for the transaction to work properly, and you can always delete those steps by pressing the delete record button at the bottom of the General tab.
If we are making any GET requests on a specific step of the transaction, you will be able to see those requests by clicking on the Get Params tab.
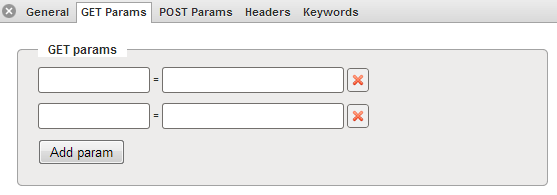
In our case we do not have any GET parameters but you can always manually add or remove parameters from the GET request. By clicking on the Add param button, you can add additional variable fields, while the X button deletes parameters.
The POST Params tab
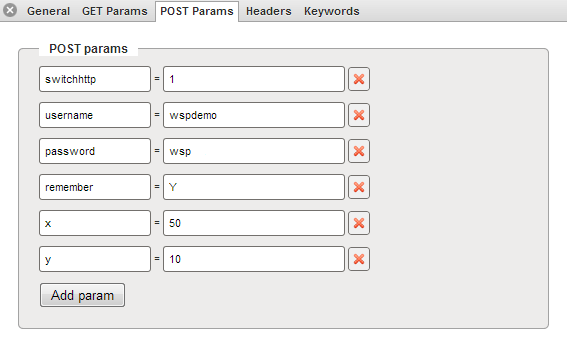
will show you the parameters of the POST request for the specific step. You can also manually add or remove variables using the Add param and X buttons here.
The Headers tab,
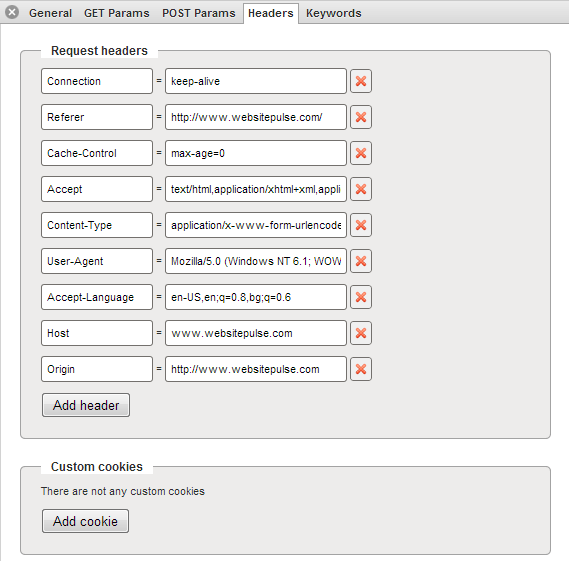
allows you to customize the headers which we will send to your server. You can create any custom header you want. If you want to easily filter our requests out from your server statistics, you can enter a custom user agent or a referrer link. Some application servers will not work correctly if you do not set the correct Accept-Language value so you are able to customize those values as well.
If your application requires a custom cookie, you can enter it here as well. You can also always add extra header information or remove some data.
The final tab is Keywords.
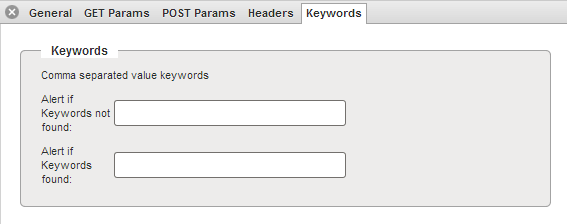
You can enter keywords for our agent to look for in the source code of the specific step. Keep in mind that the keywords are case sensitive and the easiest way to enter them will be to copy them directly from the source code cache.
If you do not want to go through all these tabs for every single step of the transaction, you can always edit these settings after you upload it in your account.
Once the transaction is uploaded, you should review its basic settings and advanced settings again. In your web-based control panel, you have extra options which cannot be configured directly from the add-on. Also, you should pay special attention to the Alerts configuration there if you want to be alerted when we detect a problem with the transaction. You can set reports by email and schedule downtime rules only from the control panel and not from this extension.
Try our transacrion monitoring for free.


 Copyright 2000-2026, WebSitePulse. All rights reserved.