

Your website is critical to your business. It is your digital shopfront where you engage with the world and turns prospects into customers. To convert the maximum number of people, you need to monitor your website to ensure an optimal experience.
This guide will discuss six monitoring metrics that every business should track. By monitoring these metrics, you can ensure you're providing the best experience to site visitors. Let's jump into this guide.
1. FP and FCP
There is a direct correlation between site speed and user experience. The longer your site takes to load, the more visitors you lose. The graph below illustrates the link between page load time and bounce rate.
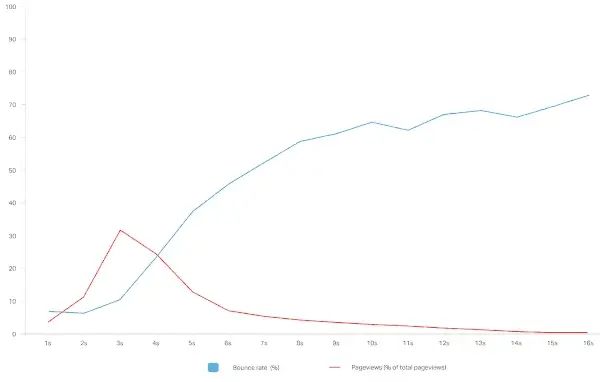
There are several ways to track page load time. First Paint (FP) and First Contentful Paint (FCP) are the two website metrics you should track.
First Paint is what you see when the browser starts loading your site's visuals. First Contentful Paint, on the other hand, refers to when the browser displays the first pieces of webpage content, such as text and images.

Your FCP should load in less than 2 seconds. Longer than this, and you see a big jump in the bounce rate.
So, how do you optimize your FP and FCP?
FP and FCP loading times usually increase due to stylesheets and render-blocking scripts. To improve loading times, then remove those render-blocking sources and unused CSS. After that, identify the minimum required styles to display a page.
You can cache or use HTTP/2 server push to improve FP loading times.
A server push is the server's ability to send multiple files in response to a specific client request. You can read more about server push in this guide.
You can use a tool like WebSitePulse's Web Page Speed Test Tool to check your site load speed. The tool provides an overview of how fast a page on your site loads and a list of suggestions to improve performance.
2. Bounce rate
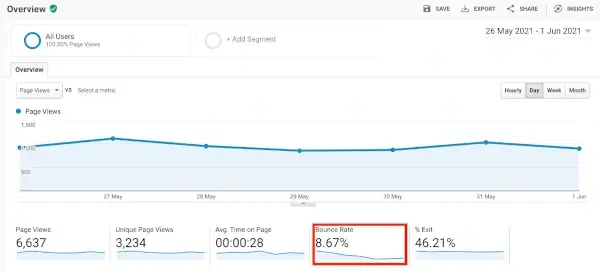
Bounce rate is the percentage of website visitors who leave a website after viewing only one page. Usually, bounce rates between 26% and 40% are considered "excellent." Check out that study's grading system for bounce rates:
- 41% to 55%: roughly average
- 56% to 70%: higher than average but not cause for alarm.
- Over 70%: you have a problem.
So, what should you do when you go over that 70% threshold?
You need to assess your website. One of the best tools for reviewing the bounce rate across your site is Google Analytics. Click on Behavior from the side menu, then Overview.
You can conduct a page-level analysis of the bounce rate. That will provide insights about a particular page on your site. You can also review the Behavior Flow tab, which shows where people went after visiting the first page.
After conducting an analysis, put yourself in your audience's shoes and navigate the site.
Review the structure of the content you're creating for your site. Try to identify the elements that negatively affect the user experience. You can then make improvements to your site and measure the impact.
Through a process of trial and error, you will improve the user experience.
3. New Vs. Returning Visitors
Every business has a core group of users. These are the people who come back to your site or business month after month. They are the foundation of your company, and if you're running a website, you need to monitor this metric.
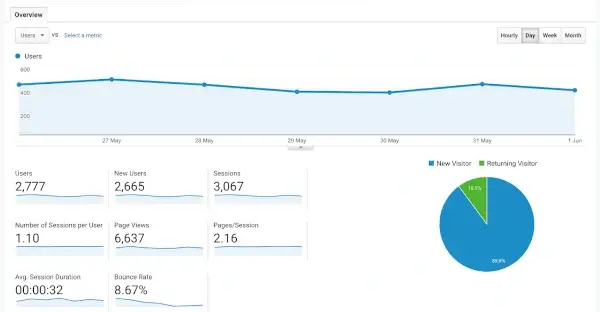
If people are coming back to your website, it means they like the content you are producing or the products you are selling. You can track the percentage of people who return to your website by monitoring new vs. returning visitors on Google Analytics.
You can access this data through the Audience tab. You can see the pie chart on the right side of the screen.
You can use various strategies to increase the number of returning visitors to your website. For example, if you can establish your site as an excellent resource for a topic, something we're trying to do by creating a site all about course platforms, people will seek your content.
You can track the number of people searching for your site by reviewing branded searches through Google Search Console. A branded search term is when a person enters your brand name followed by another word to find your site.
4. Requests per second
Requests per second (RPS) refers to the total number of actions sent to the target server every second. A request can refer to any page resource: multimedia files, images, you name it.
But why should you monitor this particular metric?
Server requests contribute to server load, which, in turn, can affect server performance. Your chosen server should be able to carry that load for optimal website performance.
So, the question is this: How much can a server carry?
That depends on the server. For example, an RPS of less than 1,000 is a low load for a regular server. An RPS of 2,000 is still reasonably decent. If you go beyond that number, you need more considerable servers for your website to run correctly.
You can use load testing to determine a server's maximum operating capacity. In load testing, you send as many requests as possible to a server and check the number it can successfully return.
5. Peak response time
Peak response time (PRT) measures how long a website request-response cycle takes. Instead of taking the average, though, PRT is the time of the longest cycle. There are response time testing tools you can use to determine PRT. Here is a list of a few tools you could use:
- JMeter
- Adobe Experience
- Load Runner
PRT is essential because it helps you determine which parts of your website take longer to respond to visitor requests. For instance, you might find that a large database query leads to slower response times. As a result, a specific page doesn't load at the time you wish it did. Read this guide to learn about database performance monitoring.
6. Downtime
Downtime is the amount of time that your website is either inaccessible or where the site lacks functionality. The most common reason your site is down is an issue with your hosting provider. The company hosting your website might turn your servers off for maintenance. That can happen once or twice a year.
More problematically, your website could go down because the server crashed for whatever reason. That is more of an issue than maintenance because it's unexpected.
You need to know when your website is inaccessible and how frequently a site is unavailable. After all, when a site goes down, people can't access it. Furthermore, if your site is often inaccessible, it can impact your search rankings.
You can use uptime monitoring software to track downtime and identify website functionality issues.
Bottom Line
Your website is a critical component of your business. It helps you promote your products and services. It's also where consumers usually get more information about your brand. In many instances, it's their first point of interaction with your company.
This guide discussed some of the essential website metrics every business should track. The list of metrics included first pain and first contentful paint, bounce rate, new vs. returning visitors, requests per second, peak response time, and downtime. Tracking these metrics gives you plenty of insights into how people interact with your website.