

Every business owner understands the importance of website monitoring. It is essential to avoid website performance and availability issues. A great start would be to examine every aspect of your web infrastructure.
That's where website monitoring tools come into the picture.
With website monitoring services, you can continuously observe your website's performance and uptime. These tools make you aware of any server downtime or connection issues. They can also help you avoid security failures that allow websites to be hacked, power outages, and hardware failures with web hosts.
If you need a website monitoring tool, the top nine are listed below.
Table of Contents:
Comparison Table
WebSitePulse Overview
Sematext Overview
Middleware Overview
Pingdom Overview
Montastic Overview
TeamViewer (Web Monitoring) Overview
Better Stack Overview
Uptime Robot Overview
New Relic Overview
StatusCake Overview
Conclusion
Comparison Table of the Best Monitoring Services
| Service Name | Offered Services | Focus | Pricing & Plans |
|---|---|---|---|
| WebsitePulse | HTTP(S)/TCP/SMTP/POP3 uptime checks, Transaction (multi-step) monitoring, DNS, SSL, content & security checks, |
Broad website, server & network monitoring, with end-user transaction testing | Free Trial: 30 days full Free Plan: Basic monitors post-trial Paid: À la carte starting ≈ $3/mo; Enterprise by quote |
| Sematext | Infrastructure & host/container metrics, APM & distributed tracing, Synthetic (uptime/API) checks, Real User Monitoring (RUM), Log management |
Full-stack observability (metrics, traces, logs, UX) | Free Tier: Limited usage Free Trial: 14 days full Paid: Usage-based from ≈ $50/mo; enterprise options |
| Middleware | APM, Infrastructure/Logs monitoring, Synthetic monitoring, Real User Monitoring (RUM), Alerts |
Unified observability platform with complete ingestion control |
Free Tier: Permanently free for small teams |
| Pingdom | Uptime & DNS/SMTP monitoring, Synthetic transaction scripts, Real User Monitoring (RUM), Page speed analysis |
Website performance & user-experience monitoring | Free Trial: 30 days full Free Plan: n/a Paid: From $15/mo (basic), higher tiers & enterprise quotes |
| Montastic | HTTP(S), ping, port, and SSL/domain expiration checks, Email/SMS alerts, Webhooks, Hosted status page |
Simple, no-frills uptime monitoring | Free Plan: Forever (9 monitors @30 min) Free Trial: n/a (free plan) Paid: $5–$49/mo tiers |
| TeamViewer | HTTP(S) uptime & transaction monitoring, Real User Monitoring (RUM), Server/device health (CPU/RAM/disk), Integrated alerts & ticketing |
Integrated remote-management + monitoring for MSPs/IT | Free Trial: 14-day monitoring module Free Plan: n/a Paid: Add-on module ≈ $20–$30+/mo; custom MSP/enterprise |
| Better Uptime | Uptime/API/port checks, Heartbeat (cron/job) monitors, Incident management & on-call scheduling, Status pages |
Uptime with built-in incident response & on-call | Free Plan: 10 monitors @3 min Free Trial: 14 days Pro features Paid: $30+/mo per “responder”; additional monitors |
| Uptime Robot | HTTP(S), ping, TCP, keyword & SSL expiry checks, Maintenance windows, Email/SMS/push/webhook alerts, Status pages |
Bare-bones uptime monitoring | Free Plan: 50 monitors @5 min Free Trial: n/a (free plan) Paid: $7/mo Solo; $29/mo Team; custom for more |
| New Relic | APM (app instrumentation), Synthetics (uptime & transactions), RUM & browser metrics, Infrastructure metrics, Logs & alerts |
Enterprise-grade full-stack observability & APM | Free Tier: 100 GB data & 1 full user Free Trial: n/a (free tier; new accounts get elevated limits) Paid: From $99/user + $0.30/GB; enterprise contracts |
| StatusCake | HTTP(S), ping, TCP & SMTP checks, Page speed tests, SSL & domain expiration monitoring, Server metrics agent, Malware scans |
Website uptime + basic performance & security checks | Free Plan: 10 monitors @5 min Free Trial: 7 days Superior/Business Paid: ≈$16/mo, Superior; ≈$55/mo, Business; enterprise |
The table shows a range of options - from lightweight, free uptime checkers to comprehensive full-stack observability platforms and tools that combine monitoring with built-in incident management. Some solutions are ideal for simple, cost-effective availability alerts, while others cater to teams needing deep performance analytics or integrated on-call workflows. A middle tier also exists, offering both uptime and performance monitoring without the complexity or expense of enterprise-grade systems.
WebSitePulse

WebSitePulse is a long-established platform focused on website and IT infrastructure monitoring. It provides comprehensive uptime tracking for websites and servers, simulating real-user interactions to
detect performance or availability issues. The platform can monitor not just basic website uptime, but also multi-step web transactions (like logins or checkout flows) to ensure critical user journeys are functioning. WebSitePulse's approach emphasizes end-user experience by using browser-like tests and multi-location
checks with verification steps to avoid false alarms.
What services does WebSitePulse offer?
- Uptime monitoring: Monitors website uptime, server availability, network components, and even email systems (SMTP/POP3).
- Transaction Monitoring: Custom scripts simulate user transactions (login, shopping cart, etc.) step by step to check functionality.
- Content & Security Checks: Checks page content, SSL/TLS certificate validity, DNS records (MX, NS, SPF), and can detect vulnerabilities in servers or web apps.
- Multi-Location & Verification: Tests run from multiple global locations with a three-stage verification to reduce false positives.
- Alerts & Reporting: Instant alerts via email, SMS, voice call, pager, IM, etc., and real-time dashboards with detailed performance reports.
What are WebSitePulse's Pros?
- Broad Monitoring Capabilities: Covers websites, servers, network ports, email round-trip, and even transaction steps in one service.
- End-User Simulation: In-browser and full-page load monitoring simulate real user experience, catching front-end issues effectively.
- False Alert Prevention: Multi-stage verification from multiple locations ensures high accuracy (reducing noise from false alarms).
- Flexible Notifications: Highly customizable alerts (email, SMS, phone, APIs) and support for many notification channels and escalations.
- Affordable Entry Point: Very low starting price per basic monitor (on the order of \$3/month) allows cost-effective monitoring for small needs.
- Customizable reports: WebSitePulse's reporting features offer real-time and historical performance data, customizable reports, and visual insights to help users monitor and optimize their website and server performance effectively.
- 24/7 Live Customer Support: Offers 24/7 live customer support, including live assistance, remote diagnostics, and alert management.
What are WebSitePulse's Cons?
- Complex Pricing Structure: Monitoring is priced per target/type (HTTP, SMTP, transactions, etc.), which can be confusing and potentially add costs as you layer services.
- Legacy Interface: The platform's interface and design are functional but somewhat dated compared to newer tools, which may affect usability for some modern DevOps teams (less sleek UI).
- Limited Integrations: Outside of notification channels, it lacks out-of-the-box integrations with collaboration or incident management tools (no built-in on-call scheduling or team workflows like some newer platforms).
- Free Features Are Basic: The post-trial free service is limited in coverage, so serious use beyond basic personal site monitoring will require a paid plan.
Pricing and Plans:
- Free Trial: Offers a full-featured 30-day free trial for new users. After the trial, a limited free plan ("Free Monitoring") is available for basic needs.
- Paid Plans: Extremely flexible pricing - you can select specific monitoring services individually priced. For example, basic server/URL monitoring starts at around $3/month, advanced web page performance monitoring at around $9/month, transaction monitoring at around $15/month, etc. These prices can scale based on frequency and number of targets.
- Enterprise Options: For large-scale requirements or custom needs, quote-based Enterprise plans are offered (with volume discounts, dedicated support, etc.). Annual billing yields discounts (e.g., ~20% off).
- Free Plan: Yes – after the trial, WebSitePulse provides a basic free service (suitable for a small number of monitors at longer intervals), though most advanced features require paid subscriptions.
WebSitePulse is well-suited for organizations that need a cost-effective yet broad monitoring toolkit. It covers uptime, transactions, and even email/DNS checks, making it handy for IT professionals managing diverse infrastructure. However, those needing modern APM-level insights or heavy integration into DevOps pipelines might find its scope limited to monitoring rather than full observability.
Sematext
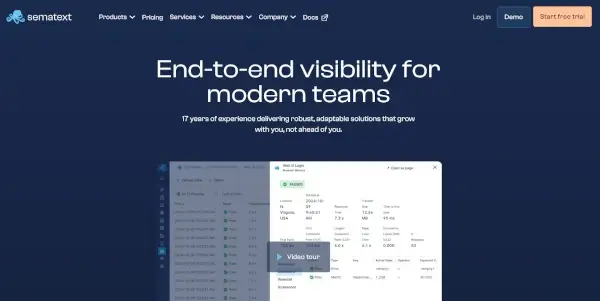
Sematext is an all-in-one observability platform that goes beyond simple uptime checks. Its primary focus is on providing unified monitoring for infrastructure, applications, logs, and user experience, which includes website availability as one component. In practice, Sematext offers website and API monitoring (including synthetic checks) alongside log management and APM, giving DevOps teams a centralized view of system health. This makes it a versatile choice for IT professionals who want both uptime alerts and deep performance analytics in one service.
What services does Sematext offer?
- Infrastructure & APM Monitoring: Covers hosts, containers, databases, etc., collecting metrics and traces to monitor backend performance and application health.
- Website & API Uptime (Synthetics): Provides synthetic monitoring for websites (HTTP/S checks) and APIs, with multi-location support and alerting on downtime or slow responses. Also monitors SSL certificate expirations and DNS issues.
- Real User Monitoring (RUM): Captures actual end-user experience data from browsers (page load times, Core Web Vitals, etc.) to complement synthetic checks.
- Log Management: Integrated log aggregation and analysis platform to correlate uptime events with log data for debugging.
- Alerts & Integrations: Customizable alert rules integrating into services like Slack, PagerDuty, etc. Also provides dashboards and anomaly detection using its analytics across metrics and logs.
What are Sematext's Pros?
- Full-Stack Visibility: Combines uptime monitoring with real user monitoring, application performance metrics.
- Flexible and Scalable: Sematext uses a usage-based model with many integrations and support for cloud-native environments (Kubernetes, Docker, etc.), making it adaptable to many setups.
- Core Web Vitals and Performance: The platform tracks detailed web performance indicators (e.g., Largest Contentful Paint, etc.) and supports page speed monitoring and synthetic transactions, which optimize site speed and reliability.
- Log and Event Correlation: A standout advantage is correlating uptime or performance alerts with log events and tracing data in the same UI, speeding up root cause analysis.
- DevOps-Friendly: As a modern SaaS, it offers robust APIs, CI/CD integrations, and Infrastructure-as-Code support (APIs/agents for metrics), which appeal to engineering teams wanting observability as code.
What are Sematext's Cons?
- Higher Cost for Small Teams: Sematext's rich feature set comes at a relatively higher price point. There is a free tier, but to use it effectively (with reasonable data retention and multiple monitors) often costs significantly more than simpler uptime-only services (their plans start around $50+/month for modest needs). This can be overkill for those just needing basic uptime alerts.
- Complex Setup: Because it offers many features, initial setup and configuration can be complex. Deploying monitoring agents, setting up log shipping, and configuring dashboards requires time and expertise. It's not as plug-and-play as a dedicated uptime tool for a quick website check.
- May Require Tuning: Usage-based pricing means managing what data you send (e.g., large log volumes or high-frequency metrics can drive up costs). It requires active management of retention and volumes to avoid surprises.
- Web Focus is Just One Part: Organizations seeking website uptime monitoring might not leverage 80% of Sematext's capabilities. In such cases, the interface might feel cluttered with unneeded APM and logging features, and a simpler tool could be easier.
- Learning Curve: With depth comes a learning curve – mastering Sematext (dashboards, query language for logs, etc.) takes effort. IT teams without a dedicated DevOps or SRE may find it challenging to fully utilize all features.
Pricing and Plans:
- Free Offerings: Sematext provides a 14-day free trial of the whole platform. It also has a perpetual free tier.
- Paid Plans: The pricing is usage-based and modular. You pay for what you use in logs, metrics, etc. Monitoring (infrastructure or synthetic) can start at a few dollars per host or monitor. Still, a typical midsize setup (with multiple monitors and decent data retention) often starts around $50/month and up. Sematext lists plans by product (Monitoring, Logging, Experience, Synthetics), each with tiers (Standard, Pro) that you can mix.
- Scalability: You can scale to enterprise levels easily – you can ingest more data or add more monitored components. Enterprise plans or high-volume discounts are available for large deployments (with custom pricing). There's also an on-premise option for companies that need self-hosting.
- No Fixed "All-in-One" Price: Because of the flexible app-scoped pricing, costs can vary widely. Using their pricing calculator, it's important to estimate your data usage (GB of logs, number of monitors, etc.). Overages are generally not charged as surprise fees (the system will require upgrades for higher volumes, ensuring predictability).
Sematext is ideal for DevOps teams and businesses that want an integrated monitoring and logging solution. If your needs span beyond uptime, performance tuning, real user experience, and log analysis, Sematext offers a one-stop platform. However, if you only need simple uptime pings and basic alerts, Sematext could be more than you need in terms of both complexity and cost.
Middleware
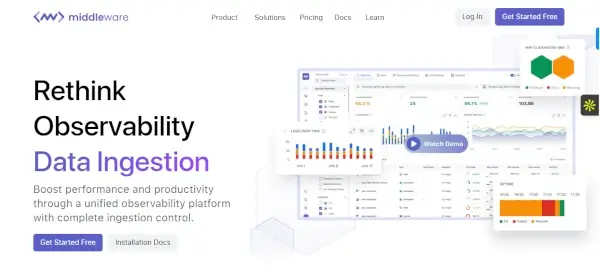
Middleware is a cloud-native observability platform designed to unify metrics, traces, logs, and events in a single pane of glass. It goes beyond traditional monitoring by leveraging AI to automate anomaly detection, root cause analysis, and incident response. Middleware's core focus is on consolidating visibility across infrastructure, applications, and user experiences while reducing alert fatigue through intelligent correlation.
What services does Middleware offer?
- Infrastructure & Application Monitoring: Monitors servers, containers, Kubernetes, cloud services, and databases in real-time. Collects metrics and distributed traces to track application performance, including code-level insights.
- Synthetic Monitoring: Supports HTTP/S, TCP, ICMP, and browser-based checks from global locations. Tracks uptime, API performance, and transaction flows.
- Real User Monitoring (RUM): Captures end-user experience data, directly from browsers and mobile devices, to identify frontend bottlenecks.
- Log Management: Centralized ingestion, storage, and analysis of logs. Enables log-to-metric correlation and pattern detection.
- AI-Driven Analytics & Alerting: Automatically surfaces anomalies using machine learning. Customizable alerts with dynamic thresholds.
What are Middleware's Pros?
- AI-Ops Efficiency: Reduces mean-time-to-resolution. Predictive alerts identify issues before outages occur.
- True Full-Stack Correlation: Unified interface links infrastructure health, application performance, synthetic checks, and real-user data.
- Cloud-Native Scalability: Built for dynamic environments. Scales horizontally to handle high-cardinality data and petabyte-scale logs.
- Cost Transparency: Clear consumption-based pricing. Free tier available.
- OpenTelemetry Native: First-class support for OTel collectors and auto-instrumentation, simplifying data onboarding for polyglot environments.
What are Middleware's Cons?
- Limited Legacy System Support: Optimized for cloud-native stacks. On-premises or legacy app monitoring may require custom instrumentation.
- UI Overwhelm for Basic Use Cases: Teams only needing uptime checks may find the interface overly complex.
- Initial Configuration Effort: Setting up granular trace sampling, log pipelines, or custom dashboards demands upfront DevOps/SRE time.
Pricing and Plans:
- Free Tier: Permanently free for small teams.
- Growth Plan: $0.3/GB data ingestion, $1 for 1K rum sessions, $1 for 5K synthetic checks.
- Enterprise Plan: Custom pricing. All plans include RUM, APM, synthetics, and alerts. Pricing scales based on: Log/event volume, Hosts/containers monitored, Synthetic check frequency & locations, and Trace ingestion volume.
- Transparent Scaling: Predictable per-unit costs. No overage fees, usage caps trigger upgrade prompts. Enterprise discounts are available.
Middleware excels for engineering teams seeking an AI-augmented, all-in-one observability platform. Its strength lies in automating insights across infrastructure, applications, logs, and user journeys, making it ideal for DevOps/SREs managing cloud-native stacks. If you need deep correlation, proactive alerting, and scalability, Middleware delivers exceptional value. However, for trivial uptime monitoring without logs or APM, a simpler/cheaper tool may suffice.
Pingdom
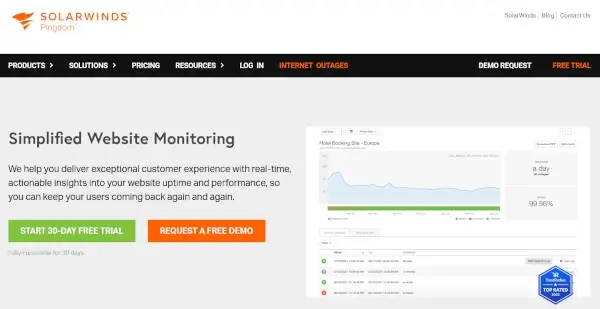
Pingdom is one of the most recognized website monitoring services, now part of the SolarWinds family. It specializes in ensuring websites are fast and reliable, offering uptime monitoring, performance insights, and user experience monitoring. Pingdom provides a mix of synthetic checks (uptime, transactions) and real user monitoring (tracking actual visitor load times), making it a comprehensive tool for web performance-minded IT professionals. Its platform is polished, with dashboards full of charts and historical data, which helps analyze trends and pinpoint bottlenecks.
What services does Pingdom offer?
- Uptime Monitoring: Regular HTTP/HTTPS checks from numerous global locations with alerting on downtime. Also monitors services like DNS and email servers for availability.
- Synthetic Transactions: Ability to script multi-step user flows (login, search, checkout, etc.) to ensure complex transactions on your site are working.
- Real User Monitoring (RUM): A JavaScript snippet to gather actual user browser metrics – so you can see page load times, user geography, device/browser stats, etc., in real-time.
- Performance & Page Speed Analysis: Detailed page speed tests that break down load times by content type and third-party assets, helping identify slow elements. Pingdom can run full page load tests and provide a filmstrip/waterfall chart for analysis.
- Alerts & Integrations: Customizable alerting via email, SMS, push, and webhooks. Integrates with incident management tools like PagerDuty, Opsgenie, and Slack for on-call escalation. Also offers public status pages to communicate outages.
What are Pingdom's Pros?
- Comprehensive Web Monitoring: Pingdom offers uptime, transaction/synthetic monitoring, and real user monitoring in one service, giving a well-rounded view of website health.
- Data-Rich Dashboards: The interface is very data-oriented, filled with charts, graphs, and historical trends.
- Strong Performance Insights: The page analysis tools are robust, essentially providing capabilities similar to dedicated speed test tools.
- Reliable and Widely Trusted: With many years in the industry, Pingdom has a reputation for reliability and accuracy.
- Scalable Plans: Offers a wide range of plans from monitoring a handful of sites to thousands of sites.
What are Pingdom's Cons?
- Learning Curve: The wealth of data and options can overwhelm new users. Tuning the alerts, understanding all the dashboards, and configuring transaction scripts requires some time and knowledge. Smaller teams might not utilize everything right away.
- Cost for Large Scale: While entry-level plans are reasonably priced, Pingdom can become expensive as you scale up monitors or require advanced features. High-frequency monitoring, many simultaneous checks, or large numbers of RUM page views might drive up the price. Enterprises monitoring hundreds of sites or transactions may find costs add up significantly (though often cheaper than full APM suites).
- Limited Infrastructure Monitoring: Pingdom is web-focused. It doesn't natively monitor server CPU, memory, logs, etc. (SolarWinds has other products). So, outside of the web domain, you'd need additional tools.
- No Log/Trace Analytics: Pingdom won't help trace a performance issue into application code or logs, unlike full observability platforms. It will tell you what is slow or down, but not always why (you'll integrate with other APM tools for root cause analysis).
- Ownership Changes: Being under SolarWinds, some users have noted changes in support or pricing over time. Also, integration with the SolarWinds ecosystem might be a con for those who only want a standalone product.
Pricing and Plans:
- Free Trial: Pingdom offers a free trial (currently 30 days for the full feature set) to test the service risk-free. Pingdom has no permanent free tier; after the trial, you must choose a paid plan.
- Basic Plans: Paid plans start at approximately $15/month for a starter package (with a small number of uptime monitors and basic RUM). This suits small websites or blogs. All plans include unlimited alerts.
- Professional Plans: Higher-tier plans add more monitors, more frequent checks (down to 1-minute intervals), more transaction monitors, and a higher volume of RUM data. Pingdom's pricing scales with the number of monitored URLs and check frequency.
- Enterprise Plans: For substantial needs (hundreds or thousands of monitors, or dedicated support requirements), enterprise pricing is by quote. These can include 30k+ checks and are tailored to large organizations.
- Notable: Non-profit or student discounts are occasionally available via SolarWinds, but generally, Pingdom is a pure subscription model. Annual subscriptions typically save ~10-20%. Also, SMS alerts beyond a certain limit may incur small fees unless using integrations.
Pingdom is a popular choice for web uptime and performance monitoring for businesses of all sizes. Organizations with dedicated web ops or DevOps functions will get the most from Pingdom. Large enterprises or those needing more backend monitoring might integrate Pingdom with other tools (or consider alternatives once costs grow).
Montastic
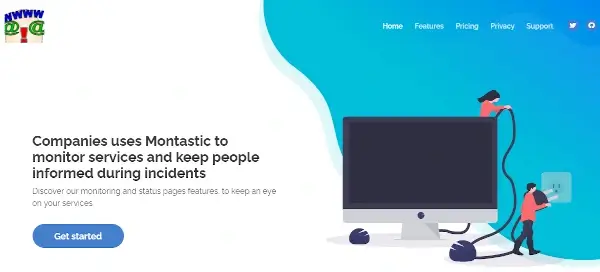
Montastic is a lightweight website monitoring service known for its simplicity and affordability. Launched in 2005, it markets itself as "the free website monitoring service," appealing to individuals, small businesses, or open-source projects that need basic uptime checks without the complexity of larger platforms.
Montastic primarily focuses on essential uptime alerts – it checks if your website is up, and notifies you if it's down – but has added a few extra features over the years, like webhooks and status pages. The platform is straightforward and minimalistic, making it easy to set up in minutes.
What services does Montastic offer?
- Website Uptime Monitoring: Regular HTTP/HTTPS checks to verify if a website (or specific URL) is reachable. The free plan checks every 30 minutes, while paid plans offer faster intervals (down to 1 minute).
- Multi-Protocol Support: Can monitor web pages, ping responses, and open ports, and track domain name expiration or SSL certificate status (useful to ensure you don't let a domain or cert lapse).
- Notifications: When downtime is detected, it supports email and SMS notifications. This ensures critical outages are noticed immediately. Higher plans include a quota of SMS per month.
- Webhooks: You can set up HTTP callbacks (webhooks) triggered on monitor events. This is a powerful feature for automation – e.g., you can have Montastic call a URL to trigger your custom script or alert system whenever a site goes down or comes back up.
- Status Pages: Even the free tier provides a basic hosted status page (yourcompany.montastic.io) with customization options (logo, colors). You can publicly list your monitored sites' status and even let users subscribe to updates (higher plans allow more subscribers).
What are Montastic's Pros?
- Generous Free Plan: Montastic's free tier allows monitoring of up to 9 URLs at 30-minute intervals, which is quite useful for personal websites, blogs, or dev environments. For open-source projects, they even offer a Business plan for free for life.
- Ease of Use: The service is extremely easy to set up.
- Cost-Effective Upgrades: Paid plans are very affordable.
- Webhooks for Automation: Unlike basic service, Montastic includes webhooks even in lower plans. This allows tech-savvy users to integrate Montastic with their own incident handling or notifications.
- Lightweight and Fast Alerts: Because it's focused on uptime only, Montastic's alerting is fast and not bogged down by other analytics. It's a "set and forget" tool, and once configured, there is very little maintenance.
What are Montastic's Cons?
- Limited Feature Set: Montastic is only for simple uptime monitoring. It does not offer advanced features like real user monitoring, detailed performance metrics, transaction testing, or server resource monitoring. IT professionals needing those will need an additional service.
- Basic Reporting: Aside from simple response time graphs and incident logs, Montastic doesn't provide deep analytics or historical reporting. The tool mainly aims to tell you "up or down" – you won't get rich dashboards or trend analysis here.
- Interval Constraints on Free Plan: The free plan's 30-minute check interval might be too slow to catch short outages. Even paid plans max out at 1-minute checks, and the number of simultaneous test locations is limited. Montastic also caps how many monitors each plan supports (e.g., ~50 on Business, 500 on Enterprise Max, so it's not meant for extremely large-scale monitoring.
- Reliability & Support: As a smaller service, Montastic doesn't have the same vast infrastructure or support team behind it as bigger players. While generally reliable, it may have fewer global check servers (so less redundancy) and support is mostly via forums or email, with potentially slower response times.
- UI and Integrations: The user interface, while simple, is also very plain. It lacks modern UX conveniences. Integrations beyond webhooks are virtually none – no built-in Slack, PagerDuty, etc. (Though you can achieve some via webhooks manually). Also, the alert methods are somewhat old-school (email/SMS) – no mobile app or push notifications.
Pricing and Plans:
- Free Plan: Yes – Free Forever for up to 9 monitors (30-min interval). This includes one user and basic email/SMS alerts. It's ideal for getting started or monitoring a few personal sites.
- Paid Plans: Montastic offers monthly billing and no long-term contract for several tiers. Key plans: Team at ~$5/month (for ~15 monitors at 5-min), Business at $10/month (50 monitors, 5-min, plus 50 SMS alerts), and scaling up through Enterprise levels. For instance, Enterprise Max is $49/month for 500 monitors at 5-minute and more SMS/webhook allowances. These higher plans also allow multiple team members and more status page subscribers.
- Trial: There isn't a formal limited-time trial because the free plan itself lets you test everything (all core features are available even on free, just at lower limits). Essentially, Montastic's model is freemium rather than trial-based.
- Special: Montastic explicitly supports open-source: qualifying projects can get the Business plan free forever. This is a nice, community-friendly gesture. Also, annual payment options are not mentioned – they primarily bill monthly, but you can cancel anytime.
Montastic is a great choice for simple, budget-friendly uptime monitoring. It appeals to IT professionals who want a no-hassle tool to keep an eye on a handful of websites and get alerted if something goes down. For more complex needs or richer insights, Montastic by itself won't suffice. Still, it can easily coexist with other tools. In summary, Montastic delivers the core uptime monitoring functionality with minimal cost and complexity, making it a handy tool in any IT toolbox for basic web monitoring.
TeamViewer (Web Monitoring)
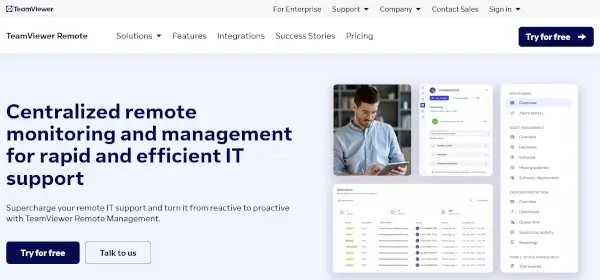
TeamViewer is widely known for its remote access software, but it also offers a monitoring service as part of its IT Remote Management suite. TeamViewer Web Monitoring (originating from their acquisition of Monitis) is an all-in-one solution that combines uptime and performance monitoring with TeamViewer's device management capabilities. This service is geared toward MSPs and IT departments already in the TeamViewer ecosystem who want to monitor their websites and servers alongside remote support. It checks websites at regular intervals and integrates alerts with the TeamViewer dashboard, allowing technicians to see issues in the same console they use for remote control. TeamViewer can help you identify problems in your website, so if it's part of your unified communications system, you don't need to worry about your entire system crashing.
What services does TeamViewer Web Monitoring offer?
- Website Uptime & Performance: Performs HTTP/HTTPS checks of websites at 5-minute intervals, alerting if a site is down or responding slowly. You can configure multi-step transactions and full page load monitoring, similar to synthetic user journeys, to detect if critical web functions fail.
- Real User Monitoring: Provides real-user monitoring data for web applications so that you can gather browser performance metrics and page load times experienced by actual visitors. This complements the synthetic uptime checks by giving in-depth data on user experience.
- Server and Device Monitoring: Beyond websites, TeamViewer's monitoring module can track server health metrics (CPU, RAM, disk) on Windows, Linux, macOS systems, and even IoT devices, due to its integration with TeamViewer endpoints. This centralizes infrastructure monitoring with your remote management.
- Alerting and Ticketing: Suspicious events or downtime trigger alerts in multiple forms – within the TeamViewer Management Console, via email or SMS, etc. If something fails a check, it can automatically create an incident for your team. This ties into TeamViewer's service desk or ticketing workflow for those who use it.
- Mobile and Multi-language Support: The TeamViewer monitoring app is available in multiple languages and accessible via mobile apps. This means on-call staff can receive and respond to alerts through the same TeamViewer mobile app they might use for remote support.
What are TeamViewer's Pros?
- Unified IT Platform: The major advantage is consolidation – teams using TeamViewer for remote support/management can monitor assets and websites in the same system. This "single pane of glass" is efficient for MSPs managing many clients, as they don't have to juggle separate monitoring software.
- Hybrid Monitoring: Combines infrastructure monitoring with web monitoring. It monitors external uptime and internal factors (server CPU, service status) that might cause downtime.
- Transaction and RUM Features: TeamViewer Web Monitoring inherited Monitis's capabilities, which include multi-step transaction scripts and real user monitoring.
- Alert Customization: You can set performance thresholds (e.g., alert if the homepage takes >3s to load) and receive alerts in various ways. Integration with TeamViewer's own alerting means that if a critical site is down, it's highly visible to support staff. Annual subscribers also note cost savings (20% off for annual).
- Free Trial & Familiar License Model: TeamViewer typically offers a 14-day free trial for its modules so that you can test the monitoring features. Licensing is either as a module added to your TeamViewer subscription or standalone. If you already have TeamViewer Premium or Corporate, adding monitoring is straightforward.
What are TeamViewer's Cons?
- Limited Standalone Use: This service is less appealing outside the TeamViewer ecosystem. It's really designed to complement TeamViewer Remote Management. If you only need website monitoring, the product might feel unwieldy or overpriced because you're also getting device monitoring capabilities that you may not use.
- 5-Minute Intervals Minimum: The checks run every 5 minutes at best, which is a bit slower than some competitors that offer 1-minute or 30-second intervals on premium plans. This could result in slightly delayed detection of short outages compared to those faster services.
- Fewer Monitoring Locations: TeamViewer's global monitoring network is smaller (roughly 30+ locations), and it limits each monitor to using a subset of those (e.g., five locations per check). This is fewer than some specialized services like WebSitePulse or Pingdom, which have more test nodes worldwide, potentially impacting the breadth of perspective (though 30 is often sufficient for most).
- Cost for Added Module: TeamViewer's business model for this is modular – it's often an add-on cost on top of your remote access license. For example, you might pay per monitored endpoint or per number of website monitors. For a small number of websites, this can be pricier than using a dedicated service like WebSitePulse. In reviews, users have noted that TeamViewer (in general) isn't cheap for business use, and the monitoring module is no exception.
- Feature Depth vs Specialized Tools: While it has a decent feature set, it may not be as feature-rich in web monitoring specifics as dedicated platforms. For instance, advanced analytics, complex SLA reporting, or integration with DevOps tools (CI/CD triggers, etc.) are not as developed. Also, if you need log management or APM, you'd need separate solutions; TeamViewer focuses on availability and basic performance, not deep code-level monitoring.
Pricing and Plans:
- Free Trial: A 14-day free trial of TeamViewer Monitoring is available (no credit card, typically). This allows full use of web and device monitoring features to see if it meets your needs.
- License Model: TeamViewer Web Monitoring can be purchased as a module within the TeamViewer Remote Management suite or as a standalone service. Typically, TeamViewer has subscription tiers (Business, Premium, Corporate), and the monitoring is an add-on per monitored asset.
- Indicative Pricing: TeamViewer's base remote access starts around $24.90/month for one user (commercial use). The monitoring add-on might be priced per monitored item, e.g., a pack of 10
monitors for a certain fee (TeamViewer doesn't publicly list prices for the module – it often requires contacting sales or checking within your account for module pricing). As a rough idea, expect small-scale usage to be in the tens of dollars per month range and enterprise usage to scale to hundreds, depending on the number of endpoints. - Enterprise & MSP: Custom plans for managed service providers and large enterprises bundle large numbers of monitored devices/sites. These usually come with centralized management consoles and priority support.
- No Free Plan: Unlike some competitors, there is no perpetual free tier for TeamViewer Monitoring. After the trial, you must have a paid subscription to continue. (TeamViewer's only free offering is for personal remote access, not business monitoring.)
TeamViewer's monitoring solution is best for organizations already using TeamViewer for remote management/support and want to integrate basic monitoring into their workflow. It's particularly useful for MSPs who prefer one tool for remote assistance and monitoring client infrastructure. Standalone monitoring tools might provide more value if you are not in that category. In summary, TeamViewer Web Monitoring offers competent uptime and performance monitoring with the unique benefit of tight integration into remote management. Still, it may not compete on raw feature sets or prices with dedicated monitoring specialists for general-purpose use.
Better Stack
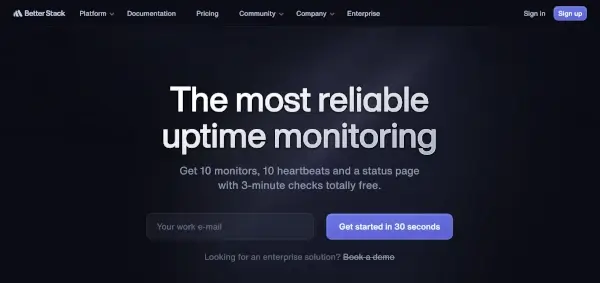
The Better Stack's Uptime is a modern monitoring service that uniquely blends incident management and on-call scheduling with traditional uptime checks. It brands itself as a polished, "beautifully designed" product that checks if your site is up and helps you manage the response when it's not. The platform provides uptime monitoring for websites and services, similar to others. Still, its standout feature is how it handles alerts: it can call, SMS, or Slack your team based on on-call rotations, escalate incidents, and even integrate an on-call calendar. Essentially, Better Stack aims to reduce the time from outage detection to resolution by ensuring the right people are alerted in the right way.
What services does Better Stack Uptime offer?
- Uptime & Performance Monitoring: Regular monitoring of websites (HTTP/HTTPS), APIs, DNS records, and ports. Checks can be as frequent as 30 seconds on high plans, and the system captures screenshots and error logs when downtime is detected for easier troubleshooting.
- Incident Management: Built-in incident tracking – when a monitor goes down, Better Stack opens an incident, aggregates notifications, and tracks status until it's resolved. You can add and assign notes, and post-mortem data is logged (including an AI-generated incident analysis on higher tiers).
- On-Call Scheduling: A full calendaring system to define who is on call at what times, with escalation policies. For instance, if the primary on-call doesn't acknowledge an alert within X minutes, it can escalate to a secondary contact. Alerts can be via phone call (with text-to-speech message), SMS, push notification, email, or Slack, among others.
- Status Pages: Hosted status pages that are easy to customize (custom domain, branding) to communicate outages to end-users. Subscribers can sign up for updates. This is included even in free accounts (with limitations) and is more fully featured in paid accounts (incident history, etc.).
- Integrations and Heartbeats: Offers integrations with tools like Slack, MS Teams, PagerDuty, and more for alerts. Also provides "Heartbeat" monitoring for cron jobs or scheduled tasks – you can ping Better Stack from your job, and if it doesn't receive a ping within the expected interval, it will alert you (indicating a likely failure of that job).
What are Better Stack's Pros?
- Incident + Monitoring Combo: Better Stack's biggest pro is that it combines uptime checks with incident response coordination.
- User-Friendly Interface: It's frequently praised for a clean, modern UI/UX that is intuitive. Setting up monitors is straightforward, and the dashboard is visually appealing.
- Fast and Reliable Alerts: Notifications are extremely fast and reliable.
- Free Plan & Generous Features: A free tier includes 10 monitors with a 3-minute check frequency and even one status page.
- Great for Teams: The on-call scheduling, team management, and integration with Slack for incident tracking make it excellent for IT teams.
What are Better Stack's Cons?
- Scale Limitations: While fine for dozens of monitors, the UI can become a bit cumbersome if you manage hundreds of monitors (some users report it's not as easy to organize a very large number of checks). There's tagging and search, but large enterprises might find it less straightforward than some competitors built for scale.
- Cost for Higher Tier Features: The free plan is great, but to unlock advanced capabilities (30-second checks, unlimited team members with separate on-call schedules, advanced analytics, etc.), you'll need paid plans which start at a relatively higher price point (~$30/month per "responder" user). For example, if you have many team members who need to receive phone call alerts, costs can add up as each on-call "responder" is a billed seat.
- Integrations Still Growing: It has the basics covered (Slack, Teams, email, webhooks). However, it may not have as extensive an integration ecosystem as some older services. For instance, if you need integration with a specific ticketing system or custom tool, you might rely on webhooks or Zapier. A user note suggests a desire for more integrations, though the team is actively adding these.
- Relatively New Company: Being newer on the market means it doesn't have the decades of track record that something like Pingdom has. While reliability has been great so far, extremely risk-averse organizations might be cautious to adopt a newer service for mission-critical alerting.
- No Deep APM/Diagnostics: Better Stack will tell you that something is down and help you respond, but it won't tell you much about why. It doesn't do deep application performance metrics or log analysis. You'd integrate it with other tools (Better Stack does offer a separate logging product, but that's distinct). So it's not an all-in-one observability tool - it's focused on uptime and incident handling.
Pricing and Plans:
- Free Tier: Yes, Free Forever is for basic use and includes 10 monitors (HTTP, ping, etc.), 10 "heartbeat" job monitors, and one status page, with a 3-minute check frequency. Alerts via email and Slack/webhooks are included; phone/SMS alerts are limited on free (only very basic incident emails). This is quite generous for hobby or small sites.
- Pro Plans (Responder License): Better Stack uses a unique model: paid plans are essentially per on-call user ("responder") licenses, starting at $30–$34 per month per responder (with discounts on annual plans). With one paid responder account, you unlock faster checks (up to 30s), unlimited phone/SMS alerts, on-call scheduling, incident escalation, etc. That license also includes a set number of monitors (e.g., 10 monitors included, and then you can buy additional monitors in packs). For example, one responder at $30/mo comes with 10 monitors; if you need 60 monitors, you'd purchase extra monitor packs for an added fee.
- Team and Enterprise: You'd get multiple responder licenses if you have multiple on-call team members. A "Team" might be five responders, etc. Pricing scales roughly linearly with team size, though higher plans may add features like longer data retention, advanced analytics, or SSO. They also offer an Enterprise plan for large organizations that need things like custom contracts, enhanced security (SOC2), and priority support – these are by custom quote.
- Free Trial: There is a 14-day free trial of Pro features (when you first sign up, you can enable a trial to experience all advanced features). Additionally, they have a 60-day money-back guarantee on paid plans, which shows confidence in their product.
Better Stack is an excellent choice for IT teams that value integrated incident response. It's particularly useful if you have on-call rotations and need a fast reaction to downtime – it tells you something's wrong and ensures someone is woken up to fix it. Its polished interface and strong free tier also make it appealing to startups and organizations that want a modern, all-in-one uptime tool. If you simply need basic monitoring without the on-call bells and whistles, you might not justify the cost of Better Stack's paid plans, but for many, the reduction in downtime resolution time pays for the service itself.
Uptime Robot
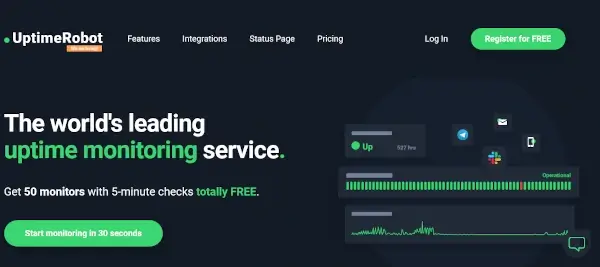
Uptime Robot is a hugely popular uptime monitoring service known for its generous free plan and simplicity. It started as one of the first free uptime monitoring tools and has since grown to monitor millions of websites. The platform focuses squarely on monitoring availability – it's not heavy on extra features, but it delivers on the promise of reliably alerting you when your website or service goes down. Uptime Robot's ease-of-use and value-for-money make it a common starting point for individuals and small businesses, while paid plans add more capability for professional use.
What services does Uptime Robot offer?
- Uptime Monitoring (HTTP/S): Checks websites for a 200 OK (or other configurable status) every 5 minutes on the free plan (and up to every 1 minute on paid). If a site is down (e.g., non-200 status or no response), Uptime Robot performs a couple of rechecks and then triggers an alert.
- Multiple Monitor Types: In addition to HTTP, it supports ping monitors, TCP port checks, keyword checks, and SSL certificate expiry monitoring
- Maintenance Windows: Ability to schedule maintenance periods to suppress alerts during planned downtime.
- Alerting: Alerts via email (free) and through integrations like SMS (limited credits on free, more on paid), push notifications (via mobile app), Slack, Microsoft Teams, Telegram, webhooks, etc.
- Status Pages: Provides simple public status pages where you can list some or all of your monitors to show their current status and history. Uptime Robot's status pages are basic (not as customizable or pretty as some competitors), but functional for sharing uptime data with users.
What are Uptime Robot's Pros?
- Generous Free Tier: The free plan gives you 50 monitors with 5-minute checks for unlimited time.
- Ease of Setup: Setting up Uptime Robot is a matter of minutes. The UI is simple and focused.
- Reliable Core Functionality: Despite being low-cost/free, it's quite reliable for basic monitoring.
- Cost-Effective Upgrades: When you need more, the paid plans are affordable, starting at just $7/month.
- Integrations and API: Uptime Robot offers a robust API, which allows integration with other systems
What are Uptime Robot's Cons?
- Lacks Advanced Features: Uptime Robot intentionally sticks to basics. It does not offer real-user monitoring, advanced performance analytics, or multi-step transactions. If you need those, you must look at other solutions.
- Limited Historical Data (Free): Logs are only stored for 3 months on the free plan. Also, the free plan doesn't provide much regarding SLA reports or advanced alert customization.
- No Phone Call Alerts: Alerts are mostly text-based (email, text, push). There is no built-in voice call functionality for critical incidents.
- Recent Free Plan Changes: It's worth noting that Uptime Robot made some changes to its free plan usage policy for commercial users. While a free plan still exists, some users felt that the company started encouraging upgrades more strongly (e.g., requiring confirmation that free accounts are non-commercial).
- Interface Is Basic: Although easy to use, the UI isn't as slick or modern as some newer products. Managing a very large number of monitors can get unwieldy (no tagging or grouping in the interface, aside from manual naming conventions). The status pages are also quite plain (no advanced customization like custom CSS unless you use their API to build your own).
Pricing and Plans:
- Free Plan: Yes – Uptime Robot's claim to fame. Free forever for up to 50 monitors, 5-minute check interval, 1 SMS alert, and unlimited email alerts. This plan also allows up to 50 HTTP(s) monitors, plus additional types like 50 ping or port monitors (the limit is combined across types).
- Pro (Paid) Plans: The paid plans were recently restructured into tiers: Solo Plan: $7/month, which gives 50 monitors at 1-minute intervals, 20 SMS/month, one status page with custom domain, and longer retention, among other perks. Team Plan: $29/month for 200 monitors, more status pages, multiple users (for team collaboration), and priority support. A Business/Enterprise tier exists around $49-$69+ with even more monitors and white-label features, or you can contact sales for very large numbers.
- Free Trial: Uptime Robot has no separate paid trial because you can use the free plan indefinitely. However, when you register, they often give an option to trial the Pro features for a short period (like 7 days) to see if you want to upgrade. They also have a 10-day money-back guarantee if you pay and change your mind.
- Enterprise Options: Uptime Robot offers custom plans or an on-premise option via its engine for very large requirements.
- Notable: All paid plans remove ads on status pages and allow SSL cert and ping monitors at 1-minute intervals. Also, Uptime Robot frequently offers discounts for annual plans (e.g., 20% off) and occasionally lifetime deals via third parties.
Uptime Robot is good for those who need straightforward uptime monitoring at a low cost. It's the first choice for many personal projects, startups, and even IT pros who just want to keep an eye on a set of services without fuss. Just remember its scope – if your needs grow into performance monitoring or complex incidents, you may eventually pair it with or migrate to a more advanced tool.
New Relic
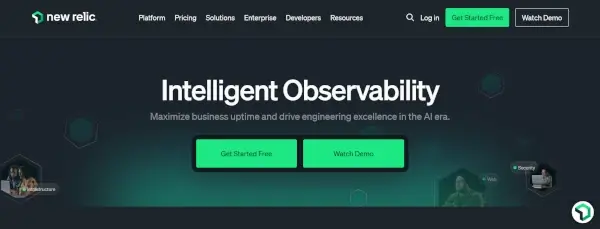
New Relic is a comprehensive observability and Application Performance Monitoring (APM) platform offering website uptime and synthetic monitoring as part of its product suite. It's an enterprise-grade solution covering everything from distributed tracing, infrastructure monitoring, and logs, to real user monitoring and uptime checks. New Relic can be a one-stop platform for IT professionals where uptime data is just one layer of a much deeper performance monitoring stack. While New Relic's primary focus is on in-depth performance metrics, it does include robust website monitoring capabilities like availability checks and external service monitoring.
What services does New Relic offer?
- APM (Application Performance Monitoring): Deep instrumentation of applications (Java, .NET, Node.js, etc.) to track response times, database queries, transaction traces, errors, and more.
- Synthetics Monitoring: New Relic Synthetics allows you to run uptime checks (ping URLs, run scripted browsers, etc.) from various global locations. These checks can monitor API endpoints, web pages, or multi-step user flows.
- Real User Monitoring: New Relic Browser captures actual user experiences on websites – page load timings, session traces, Core Web Vitals, JavaScript errors, etc., giving a comprehensive view of front-end performance.
- Infrastructure Monitoring: New Relic Infrastructure can monitor server and cloud infrastructure metrics in real-time (CPU, memory, disk, host network, container metrics, Kubernetes, etc.), so you see how underlying infrastructure might be affecting uptime or performance.
- Alerts and AI Ops: New Relic has an advanced alerting system where you can set thresholds or anomaly detection across any metric. It also offers AIOps features like detecting unusual patterns. Alerts can be routed via email, Slack, PagerDuty, etc., and it supports on-call schedules in conjunction with third-party paging tools.
What are New Relic's Pros?
- Unified Observability: New Relic provides an all-in-one platform – uptime monitoring sits alongside application telemetry, so you can quickly correlate an outage with, say, a specific server spike or a new code deployment.
- Rich Analytics and Dashboards: The amount of data and visualization New Relic offers is industry-leading. You can create custom dashboards that show uptime, error rates, throughput, and user analytics together. The query language (NRQL) allows for very flexible analysis of monitoring data.
- Scalable and Proven: New Relic is used by many large enterprises; its monitoring agents and systems are very robust. It can handle monitoring for thousands of instances and applications.
- Feature Breadth: Aside from uptime, the platform includes error tracking, capacity forecasting, distributed tracing, synthetic user journey monitoring, and mobile app performance monitoring.
What are New Relic's Cons?
- Cost for Full Use: New Relic's licensing, especially for larger environments, can get very expensive. Its pricing model is usage-based. While this is flexible, the reality is that monitoring everything (APM, logs, synthetics, etc.) can end up costing thousands per month for a busy production system. The oft-cited downside of New Relic is "sticker shock" once you move beyond the free tier.
- Complexity: There's no sugarcoating that New Relic is a complex beast. Setting it up involves installing various agents, and the UI has a lot of sections. New users can be overwhelmed by the array of options and the NRQL query system. For small teams without a dedicated DevOps or ops specialist, it might be overkill or underutilized.
- Confusing Pricing & Modules: Though consolidated under "New Relic One," there are still multiple "capabilities," and understanding what you get for free vs what's paid can be confusing. Also, certain features are only in higher paid tiers.
- Alert Noise if Not Tuned: With so much data, New Relic can overwhelm you with alerts if you don't carefully configure thresholds and incident preferences. It requires tuning to avoid alert fatigue, whereas simpler uptime monitors have more straightforward alert logic.
- Resource Overhead: The New Relic APM agents, while generally efficient, do add some overhead to your applications. In resource-constrained environments, this might be a consideration. Also, sending 100% of logs and traces might not be feasible due to cost, meaning you sometimes have to sample or limit data, potentially missing some insights.
Pricing and Plans:
- Free Tier: Yes. New Relic has a perpetual free tier, which includes 1 Full user, 100 GB of data ingestion per month, and unlimited "basic users" who can view dashboards.
- Standard/Pro Plans: New Relic moved to a unified usage-based pricing. Practically, this means if your data or user count exceeds the free allotment, you pay for what you use. There are two data pricing options: original (about $0.30 per GB over free) and a higher tier with longer retention at $0.50/GB. Additionally, Full users cost around $99/month each (this is the figure often cited as "paid plans start at $99"). If you need more data but no extra users, you might not pay the full $99, but in practice, many teams need multiple user seats too.
- Enterprise Plan: For large enterprises, custom pricing is available – typically annual contracts with volume discounts, high support SLAs, and often an option for on-premise data storage or FedRAMP compliance if needed. These can run into six or seven figures annually for very large deployments.
- Free Trial: Since there's a free tier, New Relic doesn't need a traditional time-limited trial. However, new accounts often get a period of Pro features with higher limits (for example, a 30-day period with Pro-level data retention and more users). This allows one to simulate the experience of a paid plan before reverting to free limits.
New Relic is a powerhouse suitable for mature DevOps environments requiring full-stack observability. If you simply need to ensure your website is up, New Relic is like using a combine harvester when a lawnmower would do – powerful but potentially overkill. On the other hand, if your organization already uses New Relic for APM or infrastructure, leveraging its synthetics for uptime makes sense to consolidate tools. In short, New Relic is recommended when deep insights and a unified monitoring ecosystem are more important than ease and cost; it shines in complex, large-scale systems where the investment in the platform pays off by drastically reducing mean-time-to-resolution with rich data.
StatusCake
StatusCake is a website monitoring service that positions itself as a direct competitor to the likes of WebSitePulse and Uptime Robot, offering both a robust free plan and paid plans with advanced features. StatusCake focuses on website uptime and performance monitoring, with a few handy extras like domain expiry and malware checks.
What services does StatusCake offer?
- Uptime Monitoring: Checks your website or server availability from over 28 countries worldwide. It supports HTTP/HTTPS, ping, TCP port, and SMTP/POP checks for basic uptime.
- Page Speed Monitoring: Regular tests of page load speed from different locations, providing metrics on how quickly your site responds and highlighting if performance degrades.
- Server Resource Monitoring: On higher-tier plans, StatusCake can monitor server metrics (CPU, RAM, etc.) by installing an agent on your server.
- Domain & SSL Monitoring: It tracks domain name expiration dates and SSL certificate validity.
- Malware Scanning: StatusCake includes basic virus/malware scanning of your website.
- Alerts & Integration: Alerts via email, SMS, and integration with many platforms. It also has an API and supports webhooks for custom integrations. Multi-user support on business plans allows alert routing per contact group.
What are StatusCake's Pros?
- Robust Free Plan: StatusCake's free tier allows one to monitor up to 10 uptime monitors at 5-minute intervals, plus one SSL check and a domain check.
- Multiple Monitoring Types: Apart from just uptime, StatusCake's inclusion of page speed, domain, SSL, and even server metrics gives a more holistic view of your website's health.
- Global Test Locations: With checks from ~28 countries, StatusCake offers good geographic coverage for monitoring.
- Easy to Use: The platform is relatively straightforward and user-friendly. Adding new monitors, setting contact preferences, and viewing reports is intuitive. The learning curve is low, making it also friendly for non-specialist team members.
- Value in Paid Plans: The paid plans are competitively priced for the feature set. Each paid plan comes with a 7-day free trial to test all features.
What are StatusCake's Cons?
- Interface/UI Aging: Compared to some newer services, the StatusCake interface, while easy, is not as modern or slick. It's functional but doesn't have the fancy dashboards or UX flair of some competitors.
- Limited Free Features: The free plan, though useful, is limited in the number of monitors and lacks some features
- SMS/Calls Cost Extra: You get some SMS credits on paid plans. However, heavy SMS or phone call usage may incur extra fees or require integration with a third party. Some IT folks prefer phone call alerts for critical incidents - StatusCake doesn't natively do voice calls.
Pricing and Plans:
- Free Plan: Yes, monitors up to 10 uptime checks, interval 5 minutes. Also, 1 SSL monitor (30-min check) and one domain monitor are included. Free plan users can also use one public status page (with StatusCake branding).
- Superior Plan: ~£12.49/month (around \$15-16). Includes 100 uptime monitors at 1-minute intervals, plus page speed monitoring, server resource monitoring, and domain monitoring for multiple domains.
- Business Plan: ~£41.66/month (around \$55-60). Includes 300 uptime monitors at 30-second intervals, allowing multiple account users with role management. It also has features like a remote server monitoring agent, more status pages (with customization), and advanced reporting (like SLA reports). Enterprise/Custom: If 300 monitors isn't enough, or you need enterprise features (like thousands of monitors, dedicated IPs, etc.), StatusCake offers custom plans via sales. They don't publish those prices, but they exist.
- Trial: All paid plans come with a 7-day free trial. You can try Superior or Business features for a week to see if they meet your needs before committing. After the trial, you can either cancel or choose to subscribe.
StatusCake is a well-rounded choice for website uptime and basic performance monitoring. Especially appealing if you want a step up from free offerings without going to enterprise solutions. It sits in a nice middle-ground: more features and polish than the ultra-basic services, but still straightforward and cost-effective. IT professionals managing a portfolio of websites will appreciate features like domain/SSL monitoring as part of the package.
Wrapping up
As a business owner, you need to maintain your credibility and gain customers' trust. Website monitoring tools can help you do this. The more secure your site is, the more visitors you'll also attract. Not only will this improve your brand image. It will also increase your return on investment.
Do your research and determine what you want from a website monitoring tool. That way, you can make the best decision for your needs. You'll see how your website operations will end up running more smoothly.