05 April, 2026
Performance Tracking > 2010 Holiday Season WebSitePulse 2010 Holiday Retail Performance and Uptime ReportFor retailers everywhere, the success of the entire year depends on the next two months. The good news is that the future looks brighter than last year although shoppers will still remain extremely price-oriented and a bit reluctant to loosen the strings on their wallets. Jeffrey Grau, an eMarketer analyst and author of the report Online Holiday Sales Forecast: Optimism Is in the Air predicts a growth of 14.3% in online sales over the same period last year which will boost the holiday season sales to $38.5 billion, up from $33.7 billion last year. Retailers will now have the chance to get a lot of new customers and strengthen their relationships with their existing clients by offering rich product information, easy return policies and friendly customer service representatives. According to Grau "This holiday season consumers will open their wallets more than they have the past two years, even though they will remain extremely price-focused. Online consumers have become savvy at finding coupons, comparing prices, locating cheaper product alternatives, and exchanging shopping tactics and information about bargains with peers through social media. WebSitePulse is monitoring ten of the most popular online shopping destinations for the 2010 Holiday Season. The Reports simulate a typical online purchase transaction, like selecting an item, adding it to the shopping cart and checkout, representative for the End Users' interactions with a website. Measurements of the multi-step transactions are made every 15 minutes, simultaneously from 3 different US cities. The reporting period covers the dates between November 22, 2010 and January 5, 2011.
WebSitePulse reports the following results from web performance measurement of the websites participating in the the Holiday Retail Performance and Uptime Report: The daily Average Response time from all monitored websites was 3.662 sec.
The typical shopping transaction took the least time for circuitcity.com visitors - 2.323 sec., while the visitors of amazon.com had to be the most patient, as the shopping transaction there took in average of 8.312 sec. Three of the monitored websites delivered above-the-average response times for their transactions, while seven of them demonstrated below-the-average daily performance. The daily average uptime for the entire Group was 99.91%.
Eight websites were available with no interruptions - 100%. Eight websites' availability was above the average, while two sites dragged the average down with below-the-average availability. Report Highlights No events of particular importance or possible negative impact on the online visitors' interaction with the Websites included into the 2010 Holiday Season report were detected during the reported period, and according to WebSitePulse, the Group delivered the expected levels of End-User experience and Customer satisfaction. Please, scroll down for Detailed Reports and Charts provided by WebSitePulse: Daily Response Times 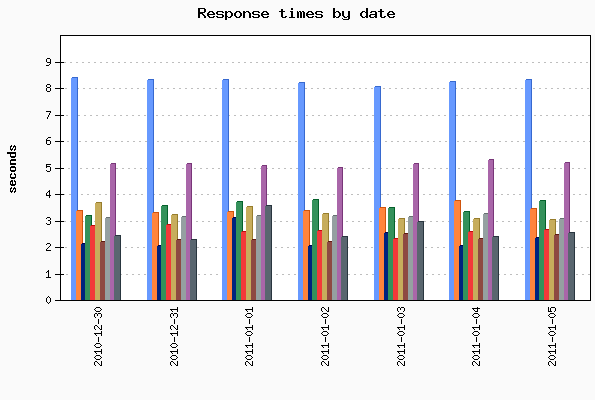
Average Response Times for January 05, 2011
Average Response Times November 22, 2010 - January 05, 2011
Hourly Average Response Times Select individual website to display: 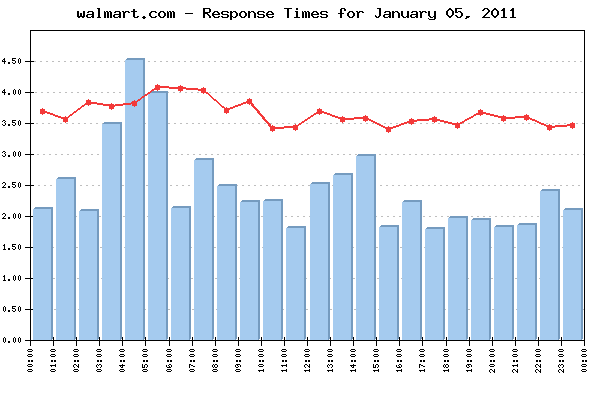 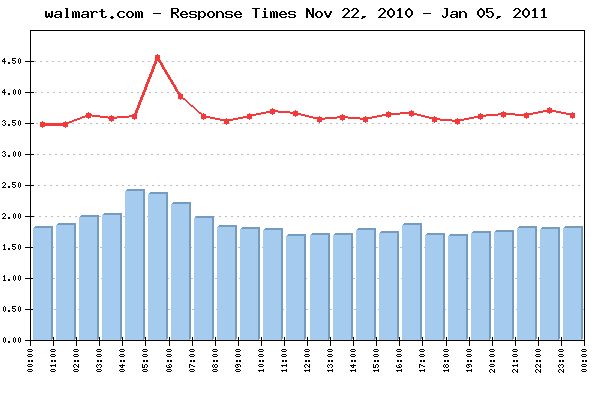
Average response times by hour for January 05, 2011
Average response times by hour November 22, 2010 - January 05, 2011
Uptime Uptime January 05, 2011
Uptime November 22, 2010 - January 05, 2011
Methodology: The 2010 Holiday Season Reports reflect a complete web transaction, representative for the End Users' interactions with a website. The reporting period covers the dates between November 22, 2010 and January 5, 2011. Performance and availability measurements are made for a typical multi-step web transaction at 15 minute monitoring interval, every day 24/7. The WebSitePulse application monitoring service is used to collect data and to create the reports. The steps in each transaction are comparable for all websites, and reflect the real online shopper experience. The simultaneous monitoring is performed from 3 US-based locations of the WebSitePulse monitoring network: Los Angeles, CA, Chicago, IL, and Washington, DC. In case of a detected malfunction or unavailability, the system performs automated error verification from 3 independent resources and only after the above procedure is performed and has returned consistent results, the detected error is confirmed, recorded, and included in the daily performance reports. In these cases, an advanced WebSitePulse exclusive feature comes into play - Forced Monitoring -, which automatically switches to a 3 minute monitoring interval for increased accuracy. About WebSitePulse: WebSitePulse is a leading provider of global, independent, and objective availability and performance monitoring of web sites, servers, network components, web applications, e-business- and email round-trip transactions. Contact: For more information about this report please contact: George T., CTO phone: 1-407-380-1600 email: Reproduction: WebSitePulse launched the Performance and Uptime Reports program to keep the general public and the Internet community informed about the performance of specific websites and the challenges their webmasters, owners and operators are facing on a daily basis, especially when the web traffic intensifies due to some special events through the year. Some of the most popular web destinations, related to each particular event, are selected for the purpose of the Reports, and data from their performance measurements is made available on the WebSitePulse public website. With the intention to broadly disseminate this information for the benefit of the Internet community, we encourage the use of this information without prior approval and under the following Terms and Conditions:
The Data from the performance measurements cannot be changed or manipulated and should be used "as is". | ||||||||||||||||||||||||||||||||||||||||||||||||||||||||||||||||||||||||||||||||||||||||||||||||||||||||||||||||||||||||||||||||||||||||||||||||||||||||||||||||||||||||||||||||||||||||||||||||||||||||||||||||||||||||||||||||||||||||||||||||||||||||||||||||||||||||||||||||||||||||||||||||||||||||||||||||||||||||||||||||||||||||||||||||||||||||||||||||||||||||||||||||||||||||||||||||||||||||||||||||||||||||||||||||||||||||||||||||||||||||||||||||||||||||||||||||||||||||||||||||||||||||||||||||||||||||||||||||||||||||||||||||||||||||||||||||||||||||||||||||||||||||||||||||||||||||||||||||||||||||||||||||||||||||||||||||||||||||||||||||||||||||||||||||||||||||||||||||||||||||||||||||||||||||||||||||||||||||||||||||||||||||||||||||||||||||||||||||||||||||||||||||||||||||||||||||||||||||||||||||||||||||||||||||||||||||||||||||||||||||||||||||||||||||||||||||||||||||||||||||||||||||||||||||||||||||