09 May, 2025
Performance Tracking > 2011 Holiday Season WebSitePulse 2011 Holiday Retail Performance and Uptime ReportConvenience and savings. These are the two keywords that will be driving up the online sales numbers this holiday season. As the National Retail Federation’s 2011 Holiday Consumer Intentions and Actions Survey predicts about 36% of all shopping tasks will be done online. This includes researching products, comparing prices and buying. If you consider the actual purchase only - over 46% of the surveyed people plan to buy the gifts for their loved ones online. eMarketer estimates US retail ecommerce holiday sales will increase with 16.8% to $46.7 billion in 2011, up from $39.9 billion in 2010. That means that online sales growth will reach double digits despite the economic uncertainty and the tight budgets of the consumers. This is largely due to the fact mentioned above – more and more price-conscious customers are hunting for a better deal online. The proliferation of mobile devices – smartphones and tablet computers – is also making it easier for the customers to choose and buy their gifts. However, it also means that the servers of the major retailers must be well prepared to take the shopping load. A slight delay and a brief moment of downtime and the customers will go to the competition. Given that the Holiday sales form about a quarter of all online sales (23.9%) it is easy to understand why the uptime and the performance of the retailers’ websites will be of crucial importance. To see how the best in the industry perform during this time of high traffic, WebSitePulse is monitoring ten of the most popular online shopping destinations for the 2011 Holiday Season. The Reports reflect a typical online purchase transaction, like selecting an item, adding it to the shopping cart and checkout, representative for the End Users' interactions with a website. Measurements of the multi-step transactions are made every 15 minutes, simultaneously from 3 different US cities. The information from the report will provide insight into the End Users' shopping experience, the reliability of the IT infrastructure of the selected Internet retailers, and their estimated losses in case of downtime and failure of critical websites, web pages, web systems, network devices, and web applications. The reporting period covers the dates between November 23, 2011 and January 5, 2012.
WebSitePulse reports the following results from web performance measurement of the websites participating in the the Holiday Retail Performance and Uptime Report: The daily Average Response time from all monitored websites was 3.729 sec.
The typical shopping transaction took the least time for overstock.com visitors - 2.277 sec., while the visitors of amazon.com had to be the most patient, as the shopping transaction there took in average of 5.922 sec. Four of the monitored websites delivered above-the-average response times for their transactions, while six of them demonstrated below-the-average daily performance. The daily Average Uptime for the entire Group was 100%. All websites were available with no interruptions. Report Highlights No events of particular importance or possible negative impact on the online visitors' interaction with the Websites included into the 2011 Holiday Season report were detected during the reported period, and according to WebSitePulse, the Group delivered the expected levels of End-User experience and Customer satisfaction. Please, scroll down for Detailed Reports and Charts provided by WebSitePulse: Daily Response Times 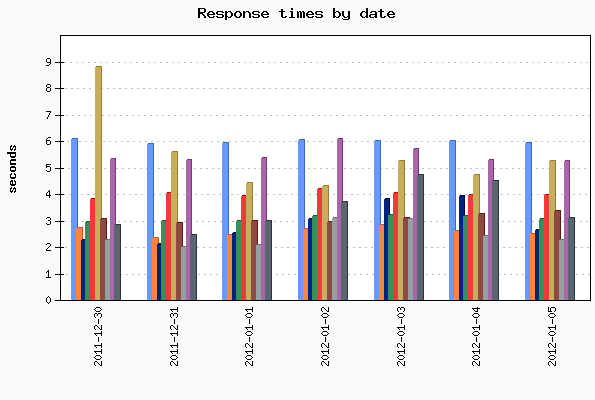
Average Response Times for January 05, 2012
Average Response Times November 23, 2011 - January 05, 2012
Hourly Average Response Times Select individual website to display: 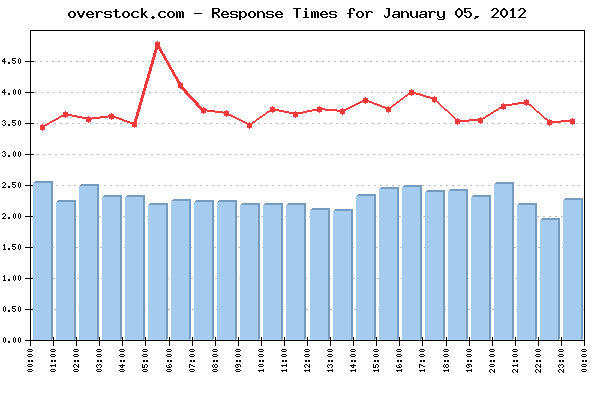 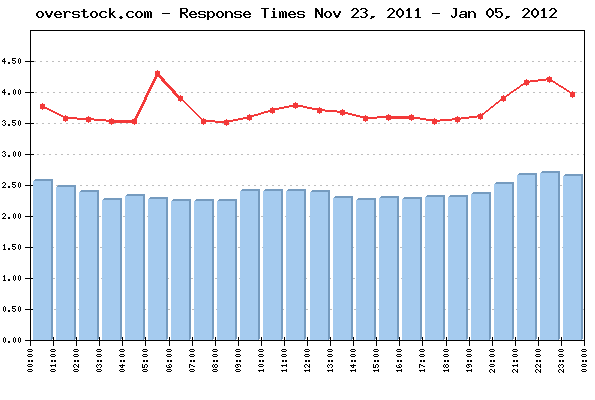
Average response times by hour for January 05, 2012
Average response times by hour November 23, 2011 - January 05, 2012
Uptime Uptime January 05, 2012
Uptime November 23, 2011 - January 05, 2012
Methodology: The 2011 Holiday Season Reports reflect a complete web transaction, representative for the End Users' interactions with a website. The reporting period covers the dates between November 23, 2011 and January 5, 2012. Performance and availability measurements are made for a typical multi-step web transaction at 15 minute monitoring interval, every day 24/7. The WebSitePulse application monitoring service is used to collect data and to create the reports. The steps in each transaction are comparable for all websites, and reflect the real online shopper experience. The simultaneous monitoring is performed from 3 US-based locations of the WebSitePulse monitoring network: Los Angeles, CA, Chicago, IL, and Washington, DC. In case of a detected malfunction or unavailability, the system performs automated error verification from 3 independent resources and only after the above procedure is performed and has returned consistent results, the detected error is confirmed, recorded, and included in the daily performance reports. In these cases, an advanced WebSitePulse exclusive feature comes into play - Forced Monitoring -, which automatically switches to a 3 minute monitoring interval for increased accuracy. About WebSitePulse: WebSitePulse is a leading provider of global, independent, and objective availability and performance monitoring of web sites, servers, network components, web applications, e-business- and email round-trip transactions. Contact: For more information about this report please contact: George T., CTO phone: 1-407-380-1600 email: Reproduction: WebSitePulse launched the Performance and Uptime Reports program to keep the general public and the Internet community informed about the performance of specific websites and the challenges their webmasters, owners and operators are facing on a daily basis, especially when the web traffic intensifies due to some special events through the year. Some of the most popular web destinations, related to each particular event, are selected for the purpose of the Reports, and data from their performance measurements is made available on the WebSitePulse public website. With the intention to broadly disseminate this information for the benefit of the Internet community, we encourage the use of this information without prior approval and under the following Terms and Conditions:
The Data from the performance measurements cannot be changed or manipulated and should be used "as is". | ||||||||||||||||||||||||||||||||||||||||||||||||||||||||||||||||||||||||||||||||||||||||||||||||||||||||||||||||||||||||||||||||||||||||||||||||||||||||||||||||||||||||||||||||||||||||||||||||||||||||||||||||||||||||||||||||||||||||||||||||||||||||||||||||||||||||||||||||||||||||||||||||||||||||||||||||||||||||||||||||||||||||||||||||||||||||||||||||||||||||||||||||||||||||||||||||||||||||||||||||||||||||||||||||||||||||||||||||||||||||||||||||||||||||||||||||||||||||||||||||||||||||||||||||||||||||||||||||||||||||||||||||||||||||||||||||||||||||||||||||||||||||||||||||||||||||||||||||||||||||||||||||||||||||||||||||||||||||||||||||||||||||||||||||||||||||||||||||||||||||||||||||||||||||||||||||||||||||||||||||||||||||||||||||||||||||||||||||||||||||||||||||||||||||||||||||||||||||||||||||||||||||||||||||||||||||||||||||||||||||||||||||||||||||||||||||||||||||||||||||||||||||||||||||||