09 May, 2025
Performance Tracking > 2014 Holiday Season WebSitePulse 2014 Holiday Retail Performance and Uptime ReportThe Holiday Season is just around the corner, and it’s truly the best time of the year for both consumers and retailers. According to Adobe, this year consumers would prefer to prolong the season instead of rushing out to buy gifts at the last minute. Extending the holiday, however, would have great benefits for retailers as well. The National Retail Federation announced they expect a 4.1% growth in sales in November and December, estimating the total spending to $616.9 billion this year. And, the retailers who have decided to stretch out Black Friday deals throughout the whole November have a major contribution to that. Considering the above, online retailers must be well prepared to meet up the consumers’ needs as well. This means they not only have to have a huge variety of items displayed on their websites, but to also make sure their websites are able to bear heavy traffic load during the Holiday season. This is necessary to ensure a flawless shopping experience for their clients. In case the website freezes or slows down, the customers are likely to go to a competitor. Thus, the online retailer will not be able to gain the full benefits of the extended Holiday season. Therefore, we have chosen 12 of the most popular online shopping websites and will monitor them throughout the whole Holiday season. We will be watching their websites’ availability and performance (uptime and response time) and will be reporting the results every day. At the end of the season we will see whether any of the monitored sites have experienced any downtime, when and why.
WebSitePulse reports the following results from web performance measurement of the websites participating in the the Holiday Retail Performance and Uptime Report: The daily Average Response time from all monitored websites was 4.428 sec.
The typical shopping transaction took the least time for qvc.com visitors - 1.872 sec., while the visitors of jcpenney.com had to be the most patient, as the shopping transaction there took in average of 12.751 sec. Four of the monitored websites delivered above-the-average response times for their transactions, while seven of them demonstrated below-the-average daily performance. The daily Average Uptime for the entire Group was 100%. All websites were available with no interruptions. Report Highlights No events of particular importance or possible negative impact on the online visitors' interaction with the Websites included into the 2014 Holiday Season report were detected during the reported period, and according to WebSitePulse, the Group delivered the expected levels of End-User experience and Customer satisfaction. Please, scroll down for Detailed Reports and Charts provided by WebSitePulse: Daily Response Times 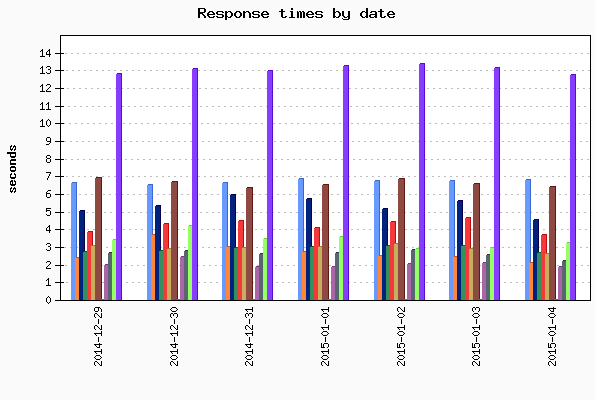
Average Response Times for January 04, 2015
Average Response Times November 24, 2014 - January 04, 2015
Hourly Average Response Times Select individual website to display: 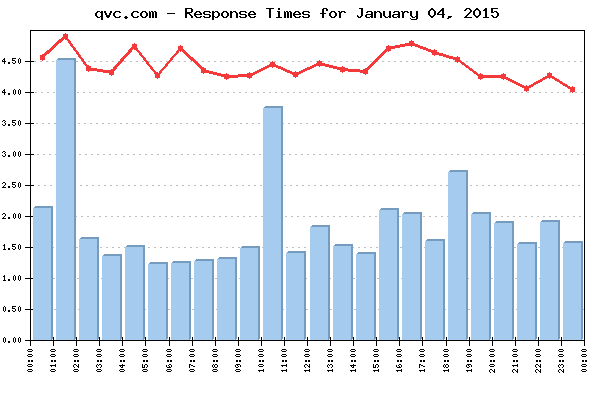 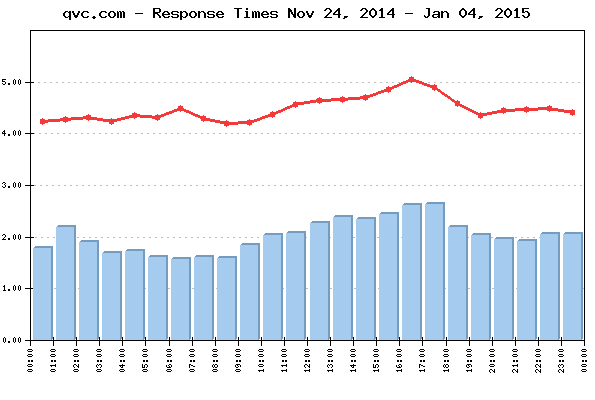
Average response times by hour for January 04, 2015
Average response times by hour November 24, 2014 - January 04, 2015
Uptime Uptime January 04, 2015
Uptime November 24, 2014 - January 04, 2015
Methodology: The 2014 Holiday Season Reports reflect a complete web transaction, representative for the End Users' interactions with a website. The reporting period covers the dates between November 24, 2014 and January 4, 2015. Performance and availability measurements are made for a typical multi-step web transaction at 15 minute monitoring interval, every day 24/7. The WebSitePulse application monitoring service is used to collect data and to create the reports. The steps in each transaction are comparable for all websites, and reflect the real online shopper experience. The simultaneous monitoring is performed from 3 US-based locations of the WebSitePulse monitoring network: Los Angeles, CA, Chicago, IL, and Washington, DC. In case of a detected malfunction or unavailability, the system performs automated error verification from 3 independent resources and only after the above procedure is performed and has returned consistent results, the detected error is confirmed, recorded, and included in the daily performance reports. In these cases, an advanced WebSitePulse exclusive feature comes into play - Forced Monitoring -, which automatically switches to a 3 minute monitoring interval for increased accuracy. About WebSitePulse: WebSitePulse is a leading provider of global, independent, and objective availability and performance monitoring of web sites, servers, network components, web applications, e-business- and email round-trip transactions. Contact: For more information about this report please contact: George T., CTO phone: 1-407-380-1600 email: Reproduction: WebSitePulse launched the Performance and Uptime Reports program to keep the general public and the Internet community informed about the performance of specific websites and the challenges their webmasters, owners and operators are facing on a daily basis, especially when the web traffic intensifies due to some special events through the year. Some of the most popular web destinations, related to each particular event, are selected for the purpose of the Reports, and data from their performance measurements is made available on the WebSitePulse public website. With the intention to broadly disseminate this information for the benefit of the Internet community, we encourage the use of this information without prior approval and under the following Terms and Conditions:
The Data from the performance measurements cannot be changed or manipulated and should be used "as is". | ||||||||||||||||||||||||||||||||||||||||||||||||||||||||||||||||||||||||||||||||||||||||||||||||||||||||||||||||||||||||||||||||||||||||||||||||||||||||||||||||||||||||||||||||||||||||||||||||||||||||||||||||||||||||||||||||||||||||||||||||||||||||||||||||||||||||||||||||||||||||||||||||||||||||||||||||||||||||||||||||||||||||||||||||||||||||||||||||||||||||||||||||||||||||||||||||||||||||||||||||||||||||||||||||||||||||||||||||||||||||||||||||||||||||||||||||||||||||||||||||||||||||||||||||||||||||||||||||||||||||||||||||||||||||||||||||||||||||||||||||||||||||||||||||||||||||||||||||||||||||||||||||||||||||||||||||||||||||||||||||||||||||||||||||||||||||||||||||||||||||||||||||||||||||||||||||||||||||||||||||||||||||||||||||||||||||||||||||||||||||||||||||||||||||||||||||||||||||||||||||||||||||||||||||||||||||||||||||||||||||||||||||||||||||||||||||||||||||||||||||||||||||||||||||||||||||||||||||||||||||||||||||||||||||||||||||||||||||||||||||||||||||||||||||||||||||||||||||||||||