* We recomment to Accept all Cookies. Required cookies are essential for the basic operations and functionality of the website, enabling core features such as user logins, account management and dashboard settings. These cookies do not track personal analytics data or enable additional features like Live Chat support sessions.
According to Claria Corporation's Feedback Research division, consumers are overwhelmingly turning to the Internet for their summer travel planning and purchasing needs. 88 percent of those who have gone or plan to travel last summer used the Internet to research and purchase their trips. 61 percent indicated they purchased or planned to purchase an airline ticket online, up from 50 percent in 2004. Online purchases of hotel accommodations also increased in 2005 to 52 percent, up from 40 percent in 2004.
We believe that this trend will repeat itself in 2006, and the most popular vacation planning and booking websites will have to respond to an increased web traffic during this period. WebSitePulse latest Report shows the performance levels and the availability of these websites, measured independently and from various remote locations to best reflect the End Users' experience.
We have selected twelve popular travel websites from US, Europe and Australia that rank at the highest search engine positions. Our intention is to broaden the scope of the Report and to provide the international Internet community with data not available in similar public documents.
Continuous monitoring for all websites covers the period May 15 through June 30, 2006. The reports and charts are updated daily showing the results from the previous day and for the entire monitoring period to the current date.
Daily Report for June 30, 2006
See report for:
WebSitePulse reports the following results from web performance measurement of the leading international summer vacation planning and booking websites:
The daily Average Response time from all monitored websites was 8.705 sec.
The Average Response time as measured from the US East Coast (Washington, DC) was:
6.416 sec.
The Average Response time as measured from the US West Coast (San Francisco, CA) was:
7.561 sec.
The Average Response time as measured from Europe (Amsterdam, Netherlands) was:
9.175 sec.
The Average Response time as measured from Australia (Brisbane, QLD) was:
11.669 sec.
The Best Response time measured from the US East Coast was:
1.584 sec.
The Best Response time measured from the US West Coast was:
2.972 sec.
The Best Response time measured from the Europe was:
2.881 sec.
The Best Response time measured from the Australia was:
3.104 sec.
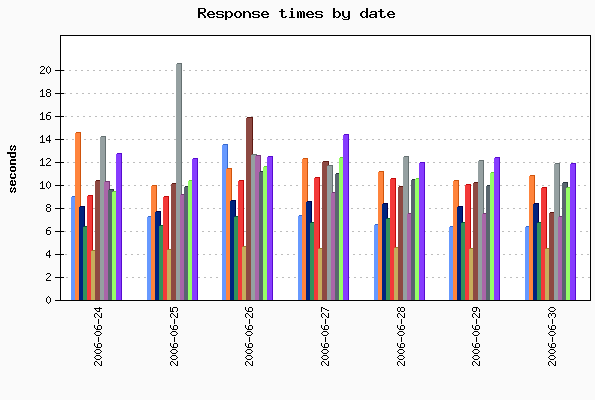
The typical booking transaction took the least time for priceline.com visitors - 4.444 sec., while the Customers of bookit.com had to be the most patient, as the transaction there took in average of 11.811 sec. Six of the monitored websites delivered above-the-average response times for their e-business-critical web pages, while six of them demonstrated below-the-average daily performance.
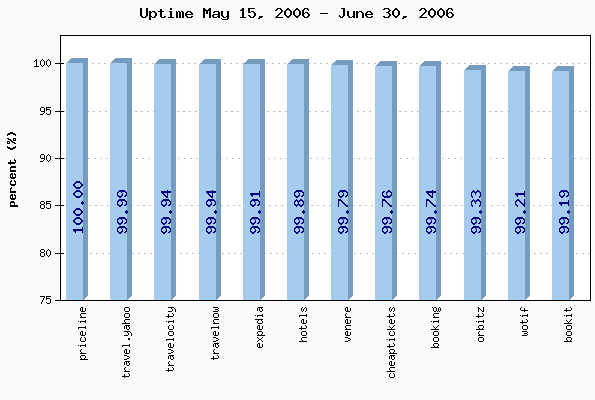
The daily average uptime for the entire Group was 99.53%.
The Average Uptime as measured from the US East Coast (Washington, DC) was:
99.80%
The Average Uptime as measured from the US West Coast (San Francisco, CA) was:
99.60%
The Average Uptime as measured from Europe (Amsterdam, Netherlands) was:
99.01%
The Average Uptime as measured from Australia (Brisbane, QLD) was:
99.70%
Ten websites were available with no interruptions - 100%. Ten websites' availability was above the average, while two sites dragged the average down with below-the-average availability.
No events of particular importance or possible negative impact on the on-line vacation research, planning and booking process were detected during the reported period, and according to WebSitePulse, the Group delivered the expected levels of End-User experience and Customer satisfaction.
Please, scroll down for Detailed Reports and Charts provided by WebSitePulse:
Daily Response Times
Legend:
expedia.com
orbitz.com
cheaptickets.com
travelocity.com
travel.yahoo.com
priceline.com
hotels.com
bookit.com
travelnow.com
booking.com
venere.com
wotif.com
Average Response Times for June 30, 2006
#
Target
Brisbane
San Francisco
Amsterdam
Washington
Avg. resp. time
1
priceline.com
7.720
2.972
5.499
1.584
4.444
2
expedia.com
9.319
3.428
8.245
4.372
6.341
3
travelocity.com
10.114
4.831
7.442
4.313
6.675
4
travelnow.com
10.149
4.913
8.350
5.303
7.179
5
hotels.com
6.336
9.820
5.566
8.547
7.567
6
cheaptickets.com
14.156
5.770
9.616
3.709
8.313
7
venere.com
13.188
11.980
6.286
7.476
9.733
8
travel.yahoo.com
12.879
5.747
14.762
5.654
9.761
9
booking.com
18.497
11.799
2.881
7.346
10.131
10
orbitz.com
18.680
7.555
11.571
5.144
10.738
11
wotif.com
3.104
11.240
18.297
14.437
11.770
12
bookit.com
15.882
10.676
11.585
9.103
11.812
Average Response Times May 15, 2006 - June 30, 2006
#
Target
Brisbane
San Francisco
Amsterdam
Washington
Avg. resp. time
1
priceline.com
7.896
3.001
5.363
1.653
4.478
2
travelocity.com
10.508
4.830
7.403
4.320
6.765
3
expedia.com
11.228
3.267
9.932
4.467
7.223
4
travelnow.com
10.860
5.365
8.448
5.504
7.544
5
hotels.com
6.513
10.425
6.357
9.640
8.234
6
cheaptickets.com
14.235
5.749
8.726
4.553
8.316
7
travel.yahoo.com
14.613
6.556
13.850
6.741
10.440
8
orbitz.com
18.210
7.949
10.589
6.574
10.831
9
venere.com
15.194
12.720
7.902
9.087
11.226
10
booking.com
19.519
13.021
3.977
8.554
11.268
11
wotif.com
5.386
13.792
22.479
17.043
14.675
12
bookit.com
18.595
13.675
16.934
14.152
15.839
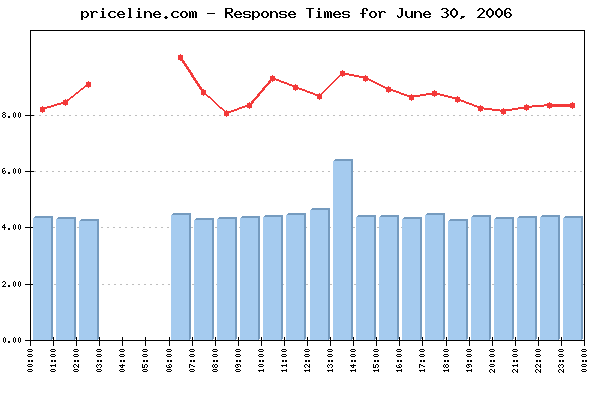
Hourly Average Response Times Select individual website to display:
Legend:
individual company response times
monitored group average response times
Average response times by hour for June 30, 2006
Target
Hours
00
01
02
06
07
08
09
10
11
12
13
14
15
16
17
18
19
20
21
22
23
booking
9.27
9.03
9.05
11.55
9.67
9.06
9.90
11.38
9.68
9.31
9.85
10.63
14.08
10.03
11.36
10.21
10.55
9.58
9.25
9.78
9.20
bookit
11.25
10.72
14.24
11.25
10.18
10.59
10.35
11.76
11.57
11.91
13.38
12.78
13.39
12.01
12.29
13.20
11.51
11.42
11.30
11.62
11.31
cheaptickets
7.65
8.34
10.51
14.50
11.35
7.17
7.35
7.54
7.76
7.76
8.05
8.53
7.45
8.01
7.32
7.39
7.47
8.14
7.34
7.21
7.74
expedia
5.57
5.46
6.01
4.92
5.17
6.45
6.69
8.16
6.43
6.19
7.66
7.08
6.89
6.67
6.71
7.17
6.05
5.59
6.21
6.10
6.17
hotels
6.64
6.21
6.61
6.54
6.39
5.69
6.90
8.28
9.90
8.69
9.68
8.90
6.27
10.58
8.19
7.43
7.37
7.27
6.79
7.51
7.32
orbitz
9.46
12.00
13.05
15.62
14.49
9.59
9.41
10.88
10.53
10.49
11.75
10.68
11.40
9.58
10.15
9.67
9.45
9.56
9.64
9.27
8.94
priceline
4.32
4.31
4.23
4.43
4.27
4.30
4.33
4.38
4.43
4.60
6.34
4.38
4.38
4.29
4.42
4.24
4.36
4.31
4.32
4.35
4.33
travel.yahoo
9.82
9.64
10.58
8.15
9.70
9.08
9.57
12.41
11.36
10.53
10.82
10.15
10.11
8.70
8.72
8.82
8.79
8.46
9.43
9.90
10.36
travelnow
6.64
7.27
6.77
6.68
7.31
6.76
6.88
7.30
7.50
6.94
7.66
8.16
6.87
7.00
9.76
7.20
6.90
6.55
7.10
6.89
6.75
travelocity
6.66
8.09
6.12
6.61
6.20
6.33
6.33
7.04
7.40
7.75
7.66
6.61
6.90
6.69
6.93
6.38
6.32
6.02
6.10
6.03
6.01
venere
9.61
8.90
9.59
17.14
9.03
10.16
10.37
11.10
10.05
7.97
8.81
9.17
7.85
8.17
7.86
8.93
8.98
9.73
10.74
10.12
10.09
wotif
11.37
11.51
12.23
13.15
11.72
11.49
11.85
11.54
11.11
11.81
11.90
14.36
11.21
11.99
11.45
12.00
11.25
10.99
11.11
11.45
11.70
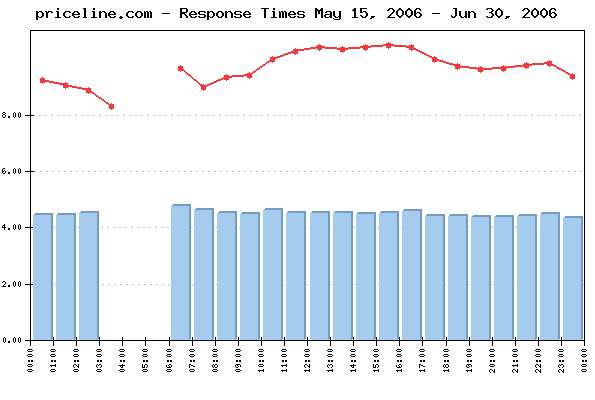
Average response times by hour May 15, 2006 - June 30, 2006
Target
Hours
00
01
02
06
07
08
09
10
11
12
13
14
15
16
17
18
19
20
21
22
23
booking
10.87
10.63
10.01
12.26
10.20
9.90
10.44
10.77
11.41
11.33
11.65
12.06
11.85
11.97
12.01
11.28
11.33
11.41
12.33
12.08
11.29
bookit
14.73
14.15
13.92
13.70
13.69
16.15
14.78
16.77
17.05
18.13
18.05
17.74
17.36
17.82
16.81
15.55
15.14
14.92
15.85
15.70
15.05
cheaptickets
8.08
7.96
7.90
8.71
7.56
7.91
7.73
8.10
8.52
8.34
8.32
8.92
8.49
8.93
8.52
8.67
8.37
8.46
8.53
8.57
8.23
expedia
6.26
5.80
5.54
5.52
5.46
6.09
6.85
7.36
7.57
7.94
7.97
8.05
9.68
8.82
8.22
7.79
7.44
7.39
7.62
7.60
6.86
hotels
7.50
7.29
7.13
7.56
7.74
7.44
7.78
8.28
9.16
9.00
9.16
8.96
9.70
9.13
8.10
7.86
8.38
8.22
8.19
8.73
8.16
orbitz
10.32
10.10
10.08
10.58
9.43
9.82
9.85
10.52
11.41
11.93
11.37
12.50
11.38
11.65
11.12
11.12
10.61
11.02
10.95
11.24
10.73
priceline
4.42
4.43
4.49
4.77
4.61
4.52
4.48
4.61
4.50
4.51
4.49
4.47
4.49
4.56
4.39
4.40
4.37
4.37
4.41
4.46
4.33
travel.yahoo
10.67
10.76
10.21
10.54
10.05
10.05
10.42
10.68
10.75
11.38
11.03
10.61
10.51
10.46
9.88
10.58
10.59
10.12
10.12
10.04
9.91
travelnow
7.13
6.93
7.08
7.22
7.30
7.35
7.48
7.80
7.91
7.73
8.01
7.86
8.90
8.47
7.79
7.37
7.32
7.10
7.24
7.53
7.18
travelocity
7.31
6.89
6.65
6.79
6.51
6.71
6.67
6.81
6.91
6.92
6.84
6.73
6.74
6.78
6.66
6.68
6.55
6.67
6.79
6.81
6.68
venere
9.81
9.95
9.91
14.17
11.58
12.41
11.96
12.83
12.81
11.51
11.68
11.44
11.23
11.16
11.24
10.20
10.18
10.63
10.23
10.54
10.32
wotif
13.64
13.73
13.31
14.13
13.67
13.80
14.62
14.99
15.33
15.88
15.20
15.41
15.21
15.13
15.04
15.51
15.37
15.52
14.92
14.59
13.63
Uptime
Uptime June 30, 2006
#
Target
Brisbane
San Francisco
Amsterdam
Washington
Avg. uptime
1
travelnow.com
100.000%
100.000%
100.000%
100.000%
100.000%
2
bookit.com
100.000%
100.000%
100.000%
100.000%
100.000%
3
booking.com
100.000%
100.000%
100.000%
100.000%
100.000%
4
venere.com
100.000%
100.000%
100.000%
100.000%
100.000%
5
wotif.com
100.000%
100.000%
100.000%
100.000%
100.000%
6
hotels.com
100.000%
100.000%
100.000%
100.000%
100.000%
7
priceline.com
100.000%
100.000%
100.000%
100.000%
100.000%
8
expedia.com
100.000%
100.000%
100.000%
100.000%
100.000%
9
travelocity.com
100.000%
100.000%
100.000%
100.000%
100.000%
10
travel.yahoo.com
100.000%
100.000%
100.000%
100.000%
100.000%
11
orbitz.com
98.780%
97.560%
94.050%
98.810%
97.300%
12
cheaptickets.com
97.620%
97.620%
94.050%
98.810%
97.025%
Uptime May 15, 2006 - June 30, 2006
#
Target
Brisbane
San Francisco
Amsterdam
Washington
Avg. uptime
1
priceline.com
100.000%
100.000%
100.000%
100.000%
100.000%
2
travel.yahoo.com
100.000%
100.000%
100.000%
99.975%
99.994%
3
travelocity.com
99.924%
99.949%
99.949%
99.949%
99.943%
4
travelnow.com
99.920%
99.924%
99.949%
99.949%
99.936%
5
expedia.com
99.837%
99.921%
99.946%
99.948%
99.913%
6
hotels.com
99.974%
99.820%
99.949%
99.820%
99.891%
7
venere.com
99.797%
99.797%
99.772%
99.806%
99.793%
8
cheaptickets.com
99.848%
99.823%
99.563%
99.823%
99.764%
9
booking.com
99.729%
99.730%
99.797%
99.691%
99.737%
10
orbitz.com
99.313%
99.356%
99.256%
99.411%
99.334%
11
wotif.com
99.291%
99.265%
99.006%
99.263%
99.206%
12
bookit.com
99.189%
99.376%
99.219%
98.988%
99.193%
Methodology:
Performance and availability are measured for a typical travel-related booking web transaction at 15 minute monitoring interval, every day between 6 AM and 3 AM local time for the different monitored websites.
For the US-based sites and those with multiple hosting servers, EST is applied to define the scheduled downtime period. The WebSitePulse application monitoring service is used to collect data and to create the reports.
The steps in each transaction are comparable for all websites, and reflect the real online buyers' experience. The simultaneous monitoring is performed from four locations of the WebSitePulse global monitoring network: San Francisco, CA; Washington, DC; Brisbane, Australia, and Amsterdam, Netherlands. In case of a detected malfunction or unavailability, the system performs automated error verification from four independent locations before it is confirmed, recorded, and included into the Daily Performance Reports.
About WebSitePulse:
WebSitePulse is a leading provider of global, independent, and objective availability and performance monitoring of web sites, servers, network components, web applications, e-business- and email round-trip transactions.
Contact:
For more information about this report please contact:
George T., CTO
phone: 1-407-380-1600
email:
Reproduction:
WebSitePulse launched the Performance and Uptime Reports program to keep the general public and the Internet community informed about the performance of specific websites and the challenges their webmasters, owners and operators are facing on a daily basis, especially when the web traffic intensifies due to some special events through the year. Some of the most popular web destinations, related to each particular event, are selected for the purpose of the Reports, and data from their performance measurements is made available on the WebSitePulse public website.
With the intention to broadly disseminate this information for the benefit of the Internet community, we encourage the use of this information without prior approval and under the following Terms and Conditions:
WebSitePulse should be referred as the "Source" of the information;
WebSitePulse should be acknowledged as the owner of the copyrights of the information in the Reports;
The texts of the Reports could be changed or altered to better suit the needs and the style of the publisher without prior notice to WebSitePulse. However, the integrity and the meaning of the information should be preserved;
The Data from the performance measurements cannot be changed or manipulated and should be used "as is".