* We recomment to Accept all Cookies. Required cookies are essential for the basic operations and functionality of the website, enabling core features such as user logins, account management and dashboard settings. These cookies do not track personal analytics data or enable additional features like Live Chat support sessions.
WebSitePulse 2010 Mother's Day Retail Performance and Uptime Report
WebSitePulse is monitoring 6 of the most popular online shopping destinations for the 2010 Mother's Day. The measurement results from monitoring a typical online shopping customer transaction reflect the performance levels and the availability of the seven websites related to the increased Internet traffic during the period.
Continuous website monitoring for all sixth Internet retailers covers the period May 5 through May 15. The detailed reports and graphical charts are updated on a daily basis, showing the results from the previous day and for the entire monitoring period up to date.
An RSS feed from the daily Reports is added for more convenience for those interested in the performance of the monitored websites.
Daily Report for May 10, 2025
See report for:
WebSitePulse reports the following results from web performance measurement of the vendors:
The daily Average Response time from all monitored websites was 2.3 sec.
The Average Response time as measured from the US East Coast (Washington DC) was:
1.970 sec.
The Average Response time as measured from the US West Coast (San Francisco, CA) was:
2.677 sec.
The Average Response time as measured from the US Central was (Chicago, IL):
2.253 sec.
The Best Response time measured from US East Coast (Washington DC):
0.200 sec.
The Best Response time measured from US West Coast (San Francisco, CA):
0.964 sec.
The Best Response time measured from US Central was (Chicago, IL):
0.916 sec.
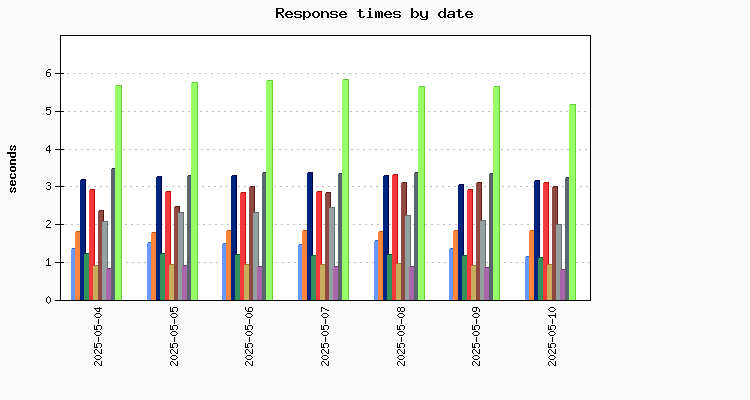
The typical shopping transaction took the least time for berries.com visitors - 0.791 sec., while the visitors of urbanstems.com had to be the most patient, as the shopping transaction there took in average of 5.149 sec. Five of the monitored websites delivered above-the-average response times for their transactions, while six of them demonstrated below-the-average daily performance.
The daily Average Uptime for the entire Group was 100%.
All websites were available with no interruptions.
Report Highlights
No events of particular importance or possible negative impact on the online visitors' interaction with the Websites included into the 2025 Mother's Day report were detected during the reported period, and according to WebSitePulse, the Group delivered the expected levels of End-User experience and Customer satisfaction.
Please, scroll down for Detailed Reports and Charts provided by WebSitePulse:
Daily Response Times
Legend:
1800flowers
proflowers
teleflora
fromyouflowers
personalizationmall
sees
gifts
gifttree
berries
helzberg
urbanstems
Average Response Times for May 10, 2025
#
Target
San Francisco
Chicago
Washington
Avg. resp. time
1
berries.com
1.118
1.054
0.200
0.791
2
sees.com
0.964
1.004
0.782
0.917
3
fromyouflowers.com
1.492
0.916
0.896
1.101
4
1800flowers.com
1.629
1.343
0.432
1.135
5
proflowers.com
1.821
2.117
1.500
1.813
6
gifttree.com
2.004
2.054
1.855
1.971
7
gifts.com
4.918
2.175
1.861
2.985
8
personalizationmall.com
3.066
3.149
3.023
3.079
9
teleflora.com
3.497
2.523
3.375
3.132
10
helzberg.com
3.559
3.116
3.006
3.227
11
urbanstems.com
5.376
5.327
4.745
5.149
Average Response Times May 02, 2025 - May 10, 2025
#
Target
San Francisco
Chicago
Washington
Avg. resp. time
1
berries.com
1.180
0.977
0.426
0.861
2
sees.com
0.967
1.019
0.766
0.917
3
fromyouflowers.com
1.552
0.967
1.060
1.193
4
1800flowers.com
2.058
1.473
0.744
1.425
5
proflowers.com
1.818
2.101
1.541
1.820
6
gifttree.com
2.103
2.267
2.036
2.135
7
gifts.com
4.302
2.102
1.810
2.738
8
personalizationmall.com
3.041
2.803
2.896
2.913
9
teleflora.com
3.521
2.739
3.551
3.270
10
helzberg.com
3.715
3.222
3.000
3.312
11
urbanstems.com
5.783
5.757
5.277
5.606
Hourly Average Response Times Select individual website to display:
Legend:
individual site response times
monitored group average response times
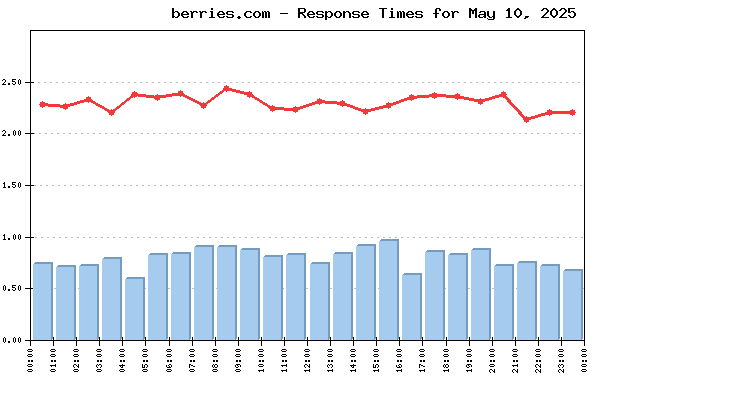
Average response times by hour for May 10, 2025
Target
Hours
00
01
02
03
04
05
06
07
08
09
10
11
12
13
14
15
16
17
18
19
20
21
22
23
1800flowers
1.29
1.09
1.08
1.15
1.14
1.03
1.24
1.05
0.94
1.24
1.12
1.15
1.19
1.14
0.99
1.09
1.15
1.18
1.22
1.18
1.36
0.85
1.27
1.08
berries
0.74
0.71
0.72
0.78
0.59
0.82
0.83
0.90
0.90
0.87
0.80
0.82
0.74
0.83
0.91
0.96
0.63
0.85
0.82
0.87
0.72
0.75
0.72
0.67
fromyouflowers
1.16
1.11
1.23
1.16
1.09
1.17
1.13
1.10
1.05
1.11
1.11
1.04
1.12
1.16
1.03
1.04
1.11
1.09
1.08
1.04
1.03
1.03
1.08
1.13
gifts
2.98
3.21
2.99
3.05
3.07
3.10
3.06
2.88
3.03
2.65
2.74
2.90
2.94
2.87
2.92
2.87
3.29
2.88
3.05
2.89
3.01
2.93
3.37
2.97
gifttree
1.69
1.85
2.37
1.40
2.16
1.34
1.66
1.64
2.15
2.16
2.20
2.13
2.15
2.17
2.12
2.03
2.24
2.27
1.86
2.31
2.35
1.75
1.71
1.59
helzberg
3.19
3.10
2.97
3.14
3.21
3.01
3.22
3.30
3.28
3.32
3.29
3.24
3.63
3.19
3.22
3.38
3.27
3.23
3.19
3.17
3.23
3.21
3.31
3.15
personalizationmall
3.57
3.10
3.42
2.67
3.75
3.85
3.64
2.58
4.14
2.86
2.67
2.78
3.27
2.77
2.36
2.77
3.21
3.72
3.50
2.94
3.63
2.34
2.08
2.29
proflowers
1.84
1.96
1.83
1.94
1.80
1.78
1.77
1.70
1.71
1.77
1.78
1.78
1.74
1.83
1.72
1.79
1.73
1.82
1.92
1.73
1.88
1.70
1.82
2.16
sees
0.85
0.88
0.97
0.95
1.12
1.00
1.21
1.29
1.00
0.99
0.81
0.87
0.72
0.82
1.01
0.69
0.86
0.76
0.89
0.77
0.81
0.75
0.90
1.07
teleflora
3.07
2.96
3.15
3.09
3.01
3.26
3.15
3.00
3.15
3.39
3.11
3.00
3.21
3.22
3.11
3.35
3.13
3.08
3.13
3.19
3.03
3.18
3.05
3.13
urbanstems
4.75
4.91
4.93
4.97
5.23
5.51
5.37
5.49
5.49
5.78
5.13
4.88
4.74
5.18
5.02
4.98
5.20
5.16
5.28
5.29
5.11
5.08
5.01
5.07
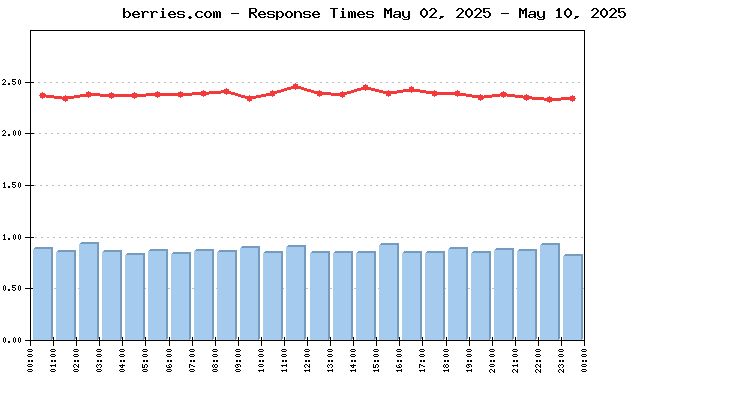
Average response times by hour May 02, 2025 - May 10, 2025
Target
Hours
00
01
02
03
04
05
06
07
08
09
10
11
12
13
14
15
16
17
18
19
20
21
22
23
1800flowers
1.45
1.31
1.47
1.42
1.37
1.43
1.40
1.47
1.40
1.38
1.50
1.55
1.35
1.43
1.62
1.37
1.44
1.46
1.51
1.33
1.41
1.46
1.34
1.35
berries
0.88
0.85
0.93
0.85
0.82
0.86
0.83
0.86
0.85
0.89
0.84
0.90
0.84
0.84
0.84
0.92
0.84
0.84
0.88
0.84
0.87
0.86
0.92
0.81
fromyouflowers
1.19
1.20
1.25
1.21
1.17
1.17
1.18
1.16
1.19
1.19
1.22
1.18
1.21
1.21
1.20
1.20
1.22
1.20
1.15
1.15
1.26
1.16
1.16
1.20
gifts
2.67
2.66
2.78
2.70
2.80
2.71
2.72
2.71
2.73
2.65
2.76
2.63
2.77
2.80
2.80
2.77
2.77
2.67
2.85
2.71
2.77
2.83
2.77
2.69
gifttree
1.96
1.82
1.78
1.69
1.97
1.72
1.96
2.03
2.25
2.18
2.48
2.36
2.48
2.44
2.43
2.35
2.37
2.30
2.14
2.17
2.26
2.09
2.15
1.86
helzberg
3.23
3.20
3.18
3.20
3.29
3.19
3.23
3.31
3.38
3.27
3.32
3.33
3.42
3.34
3.87
3.38
3.39
3.33
3.27
3.27
3.25
3.30
3.33
3.21
personalizationmall
3.15
3.25
3.26
3.44
3.19
3.46
3.24
3.08
2.82
2.58
2.58
2.50
2.78
2.53
2.53
2.63
2.92
2.83
2.94
2.79
2.89
2.72
2.63
3.22
proflowers
1.81
1.87
1.86
1.90
1.79
1.77
1.77
1.79
1.79
1.85
1.81
1.79
1.80
1.87
1.80
1.80
1.86
1.78
1.81
1.83
1.87
1.83
1.80
1.82
sees
0.94
0.91
1.03
0.97
1.03
1.00
1.04
0.96
0.97
0.96
0.95
0.87
0.88
0.90
0.87
0.88
0.82
0.85
0.84
0.85
0.83
0.83
0.90
0.95
teleflora
3.25
3.11
3.15
3.15
3.11
3.18
3.12
3.20
3.46
3.19
3.39
4.40
3.23
3.22
3.25
3.29
3.29
3.27
3.21
3.23
3.14
3.31
3.17
3.16
urbanstems
5.52
5.55
5.54
5.53
5.55
5.65
5.66
5.76
5.69
5.59
5.46
5.51
5.57
5.63
5.69
5.74
5.77
5.76
5.65
5.67
5.61
5.50
5.49
5.45
Uptime
Uptime May 10, 2025
#
Target
San Francisco
Chicago
Washington
Avg. uptime
1
1800flowers.com
100.000%
100.000%
100.000%
100.000%
2
proflowers.com
100.000%
100.000%
100.000%
100.000%
3
teleflora.com
100.000%
100.000%
100.000%
100.000%
4
fromyouflowers.com
100.000%
100.000%
100.000%
100.000%
5
personalizationmall.com
100.000%
100.000%
100.000%
100.000%
6
sees.com
100.000%
100.000%
100.000%
100.000%
7
gifts.com
100.000%
100.000%
100.000%
100.000%
8
gifttree.com
100.000%
100.000%
100.000%
100.000%
9
berries.com
100.000%
100.000%
100.000%
100.000%
10
helzberg.com
100.000%
100.000%
100.000%
100.000%
11
urbanstems.com
100.000%
100.000%
100.000%
100.000%
Uptime May 02, 2025 - May 10, 2025
#
Target
San Francisco
Chicago
Washington
Avg. uptime
1
sees.com
100.000%
100.000%
100.000%
100.000%
2
1800flowers.com
100.000%
100.000%
100.000%
100.000%
3
helzberg.com
100.000%
100.000%
100.000%
100.000%
4
personalizationmall.com
100.000%
100.000%
100.000%
100.000%
5
gifts.com
100.000%
100.000%
100.000%
100.000%
6
berries.com
100.000%
100.000%
100.000%
100.000%
7
proflowers.com
100.000%
100.000%
100.000%
100.000%
8
fromyouflowers.com
100.000%
100.000%
100.000%
100.000%
9
urbanstems.com
100.000%
99.946%
100.000%
99.982%
10
teleflora.com
99.939%
99.937%
99.942%
99.939%
11
gifttree.com
99.729%
99.767%
99.771%
99.756%
Methodology:
The 2010 Mother's Day Reports reflect a complete web transaction, representative for the End Users' interactions with a website. The reporting period covers the dates between May 05 and May 15, 2010. Performance and availability measurements are made for a typical multi-step web transaction at 15 minute monitoring interval, every day 24/7. The WebSitePulse application monitoring service is used to collect data and to create the reports.
The steps in each transaction are comparable for all websites, and reflect the real online shopper experience. The simultaneous monitoring is performed from 3 US-based locations of the WebSitePulse monitoring network: San Francisco, CA, Chicago, IL, and Washington, DC. In case of a detected malfunction or unavailability, the system performs automated error verification from 3 independent resources and only after the above procedure is performed and has returned consistent results, the detected error is confirmed, recorded, and included in the daily performance reports. In these cases, an advanced WebSitePulse exclusive feature comes into play - Forced Monitoring -, which automatically switches to a 3 minute monitoring interval for increased accuracy.
About WebSitePulse:
WebSitePulse is a leading provider of global, independent, and objective availability and performance monitoring of web sites, servers, network components, web applications, e-business- and email round-trip transactions.
Contact:
For more information about this report please contact:
George T., CTO
phone: 1-407-380-1600
email:
Reproduction:
WebSitePulse launched the Performance and Uptime Reports program to keep the general public and the Internet community informed about the performance of specific websites and the challenges their webmasters, owners and operators are facing on a daily basis, especially when the web traffic intensifies due to some special events through the year. Some of the most popular web destinations, related to each particular event, are selected for the purpose of the Reports, and data from their performance measurements is made available on the WebSitePulse public website.
With the intention to broadly disseminate this information for the benefit of the Internet community, we encourage the use of this information without prior approval and under the following Terms and Conditions:
WebSitePulse should be referred as the "Source" of the information;
WebSitePulse should be acknowledged as the owner of the copyrights of the information in the Reports;
The texts of the Reports could be changed or altered to better suit the needs and the style of the publisher without prior notice to WebSitePulse. However, the integrity and the meaning of the information should be preserved;
The Data from the performance measurements cannot be changed or manipulated and should be used "as is".