10 April, 2026
Performance Tracking > 2017 Hurricane Season WebSitePulse 2017 Hurricane Season Web Performance and Uptime Report
Planning a vacation in Florida or the Caribbean? Before you go to the beach, however, you might want to consider that the hurricane season has just began. The Atlantic hurricane season is an ongoing event in the annual formation of tropical cyclones in the Atlantic basin. The season officially began on June 1, and will end on October 31, 2017. However, most of these storms hit during peak hurricane season between August and October.
The Climate Prediction Center classifies hurricane seasons as:
The 2017 hurricane season is likely to be an above-normal hurricane season for the Atlantic, according to the Climate Prediction Center. The region has a 70% chance of experiencing between 11 and 17 storms with sustained winds of 39 mph or higher. Between five and nine of these storms may become hurricanes, or storms with sustained winds of 74 mph or higher. And anywhere from two to four of these storms could become major-category 3 to 5 hurricanes with sustained winds of 111 mph or higher. For 12th year in a row, WebSitePulse will provide free monitoring and notifications during 2017 hurricane season to 5 of the most popular websites that present their users with real-time forecasts, emergency information and donation opportunities in times of hurricanes, floods, and other natural or man-caused disasters. The WebSitePulse Performance Reports will measure the websites’ uptime and response time as the most important metrics for the availability and the reliability of any web-based operation, critical for the End Users' overall online experience. Measurements of web transactions will be made every 15 minutes, simultaneously from 3 different monitoring locations. In-depth analytical information is also collected and stored in the WebSitePulse system for future references. The Reports reflect the most common performance criteria: response time and availability - but in-debt analytical information is also collected and stored in the WebSitePulse system for future references.
WebSitePulse reports the following results from web performance measurement of the Hurricane- and disaster-related websites: The daily Average Response time from all monitored websites was 0.977 sec.
The typical shopping transaction took the least time for nhc.noaa.gov visitors - 0.525 sec., while the visitors of redcross.org had to be the most patient, as the shopping transaction there took in average of 1.962 sec. One monitored website delivered above-the-average response times for its transactions, while four of them demonstrated below-the-average daily performance. The daily Average Uptime for the entire Group was 100%. All websites were available with no interruptions. Report Highlights No events of particular importance or possible negative impact on the online visitors' interaction with the Websites included into the 2017 Hurricane Season report were detected during the reported period, and according to WebSitePulse, the Group delivered the expected levels of End-User experience and Customer satisfaction. Please, scroll down for Detailed Reports and Charts provided by WebSitePulse: Daily Response Times 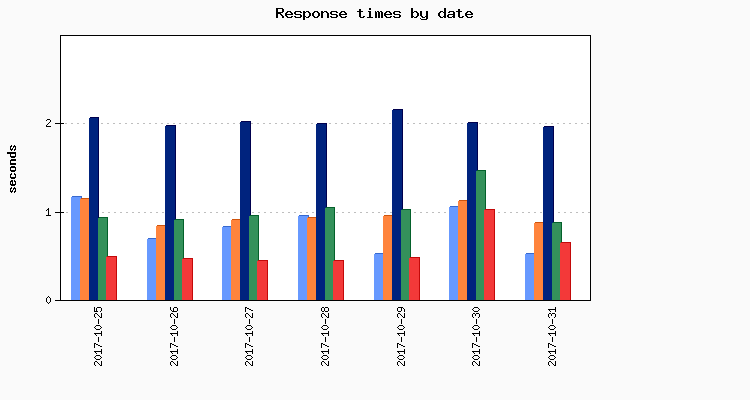
Average Response Times for October 31, 2017
Average Response Times August 01, 2017 - October 31, 2017
Hourly Average Response Times Select individual website to display: 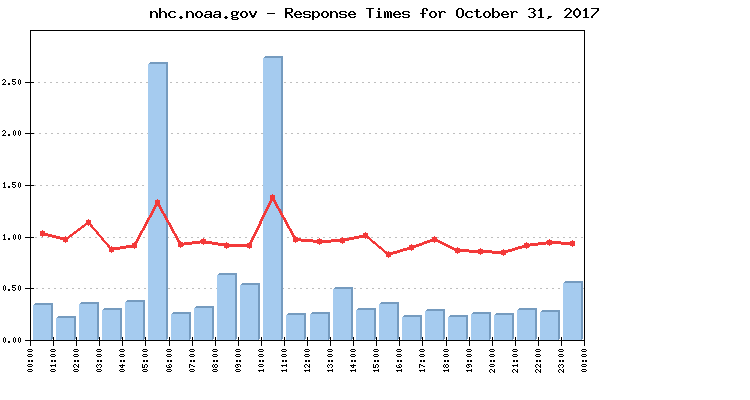 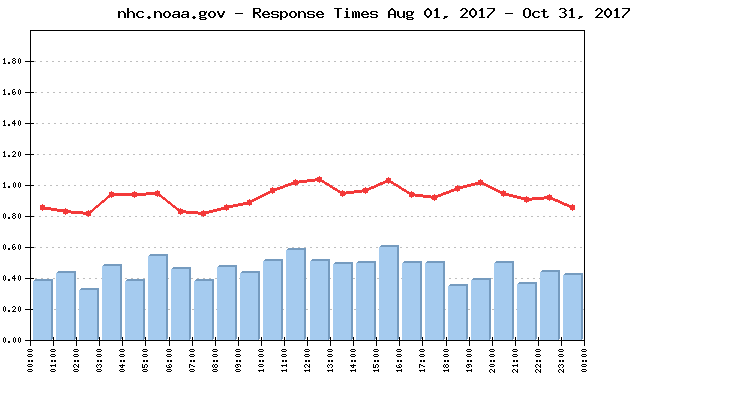
Average response times by hour for October 31, 2017
Average response times by hour August 01, 2017 - October 31, 2017
Uptime Uptime October 31, 2017
Uptime August 01, 2017 - October 31, 2017
Methodology: WebSitePulse Performance Reports measure Uptime and Response Time as the most important metrics for the availability and the reliability of any web-based operation. Performance measurement takes place daily, every 15 minutes during the entire Hurricane season. The WebSitePulse website monitoring service is used to collect data and to create the reports. The simultaneous monitoring is performed from 3 US locations of the WebSitePulse monitoring network: Trumbull, CT, San Francisco, CA and Chicago, IL. In case of a detected malfunction or unavailability, the system performs automated error verification from 3 independent resources and only after the above procedure is performed and has returned consistent results, the detected error is confirmed, recorded, and included in the daily performance reports. In these cases, an advanced WebSitePulse exclusive feature comes into play - Forced Monitoring - which automatically switches to a 3 minute - monitoring interval for increased accuracy. About WebSitePulse: WebSitePulse is a leading provider of global, independent, and objective availability and performance monitoring of web sites, servers, network components, web applications, e-business- and email round-trip transactions. Contact: For more information about this report please contact: George T., CTO phone: 1-407-380-1600 email: Reproduction: WebSitePulse launched the Performance and Uptime Reports program to keep the general public and the Internet community informed about the performance of specific websites and the challenges their webmasters, owners and operators are facing on a daily basis, especially when the web traffic intensifies due to some special events through the year. Some of the most popular web destinations, related to each particular event, are selected for the purpose of the Reports, and data from their performance measurements is made available on the WebSitePulse public website. With the intention to broadly disseminate this information for the benefit of the Internet community, we encourage the use of this information without prior approval and under the following Terms and Conditions:
The Data from the performance measurements cannot be changed or manipulated and should be used "as is". | |||||||||||||||||||||||||||||||||||||||||||||||||||||||||||||||||||||||||||||||||||||||||||||||||||||||||||||||||||||||||||||||||||||||||||||||||||||||||||||||||||||||||||||||||||||||||||||||||||||||||||||||||||||||||||||||||||||||||||||||||||||||||||||||||||||||||||||||||||||||||||||||||||||||||||||||||||||||||||||||||||||||||||||||||||||||||||||||||||||||||||||||||||||||||||||||||||||||||||||||||||||||||||||||||||||||||||||||||||||||||||||||||||||||||||||||||||||||||||||||||||||||||||||||||||||||||||||||||||||||||||