We are using cookies to ensure you get the best experience on our website. To find out more, please read our Privacy Policy section.
* We recomment to Accept all Cookies. Required cookies are essential for the basic operations and functionality of the website, enabling core features such as user logins, account management and dashboard settings. These cookies do not track personal analytics data or enable additional features like Live Chat support sessions.
|
|
How It Works > Screenshots
Screenshots
 |
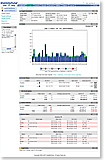
Current Status
Current Status displays all targets in the account with up to the minute status and its duration from every monitoring location.
- Shortcuts for detailed information, reports and suspend/activate
- One-click suspend/activate monitoring of all targets and suspend/activate notifications to all contacts
- Easy access to the Latest events for your Targets
- Shortcuts to all your Favorite reports
|
 |
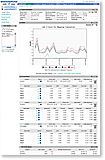
Target status details for website performance
Target Status displays real-time information and graph with details about the status and statistics of this target.
- Shortcut links to Suspend/Activate monitoring, edit target settings and target reports
- Detailed graph showing the last several hours of performance with response time, components breakdown and any errors if occurred
- Current status and last check details from every monitoring location
- Features like "cache" of the monitored target and "Instant Test" provide valuable information and diagnostic tools for quick troubleshooting
- Uptime/Downtime statistics for the current month and the life of the target
- Status history with the last five status changes
|
 |
Target status details for Web transaction
Target Status displays real-time overall and detailed transaction steps information and graph
- Shortcut links to Suspend/Activate monitoring, edit target settings and target reports
- Detailed graph showing the last several hours of overall transaction and individual steps performance and any errors if occurred
- Current status and last check details for the overall web transaction and for each step from every monitoring location
- Features like "Play cache" of the web transaction, "cache" of each individual step and "Instant Test" provide valuable information and diagnostic tools for quick troubleshooting
- Uptime/Downtime statistics for the current month and the life of the target
- Status history with the last five status changes
|
 |
Target settings
The Target settings provide the capability of editing directly any section of the Target configuration or doing it with the Step-by-step wizard.
Additional options include Suspend/Activate monitoring, Reset target statistics and Delete target.
|
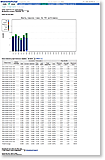 |
Daily report for website performance
- Real-time graph displays the performance response times by hour with web page components breakdown - time to resolve DNS, time to connect, redirect time, time to download first byte, time to download the whole web page contents
- Drill-down capabilities of the graph for displaying details about every check made
- Detailed log providing overall website response time and breakdown of every components response time for every check made for the selected time period
- Total or Average values for the selected time period
|
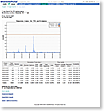 |
7-Day report for website performance
- Real-time graph displays the overall response times over the selected 7-day period
- Summarized overall website and its component response times
|
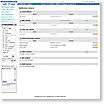 |
Notification Contacts
Contacts screen displays all notification contacts for the account.
- Edit, Delete and Suspend/Activate notifications to any contact
- Add new contacts under specific type, view prices and terms
- Select types of contacts to be displayed for easy management
|
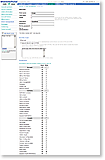 |
Multi-user support
Edit user screen allows configuration of read, write or no access rights for every individual section of the control panel.
- User details, log in info and contact email
- Several pre-configured access levels for quick and easy set up
|
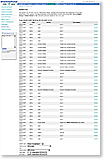 |
System Log
Displays all activities in the account for a selected time period. Every action has additional details. Allows Administrators to easily keep track of any changes or additions made by multiple users.
|
|