01 April, 2026
Performance Tracking > 2017 Holiday Season WebSitePulse 2017 Holiday Retail Performance and Uptime ReportThe Holiday Season is just around the corner. The final months of the year are filled with peak shopping days and 2017 holiday shopping season is expected to be one of the best in recent years, thanks to overall improvements in the economy, low unemployment, and an increase in consumer spending. In the United States, the holiday season is a particularly important time for retail shopping, with shoppers spending near $1 trillion. Consumer spending over the Black Friday weekend alone is expected to increase by 47% from the same period in 2016. According to RetailMeNot’s survey data, consumers plan to spend an average of $743 this year during the weekend that runs from Black Friday through Cyber Monday. That figure is up from an average of $505 over the same weekend last year. With consumers gearing up to potentially spend more this year, online retailers need to keep a close eye on their web sites, servers and web assets. For 12th year in a row, WebSitePulse will monitor 9 of the most popular shopping websites. This Performance Reports will measure the websites’ uptime and response time as the most important metrics for the availability and the reliability of any web store. Measurements of web transactions will be made every 15 minutes, simultaneously from 3 different monitoring locations. In-depth analytical information is also collected and stored in the WebSitePulse system for future references.
WebSitePulse reports the following results from web performance measurement of the websites participating in the the Holiday Retail Performance and Uptime Report: The daily Average Response time from all monitored websites was 3.492 sec.
The typical shopping transaction took the least time for target.com visitors - 0.749 sec., while the visitors of hallmark.com had to be the most patient, as the shopping transaction there took in average of 6.595 sec. Four of the monitored websites delivered above-the-average response times for their transactions, while five of them demonstrated below-the-average daily performance. The daily average uptime for the entire Group was 99.99%.
Eight websites were available with no interruptions - 100%. Eight websites' availability was above the average, while one site dragged the average down with below-the-average availability. Report Highlights No events of particular importance or possible negative impact on the online visitors' interaction with the Websites included into the 2017 Holiday Season report were detected during the reported period, and according to WebSitePulse, the Group delivered the expected levels of End-User experience and Customer satisfaction. Please, scroll down for Detailed Reports and Charts provided by WebSitePulse: Daily Response Times 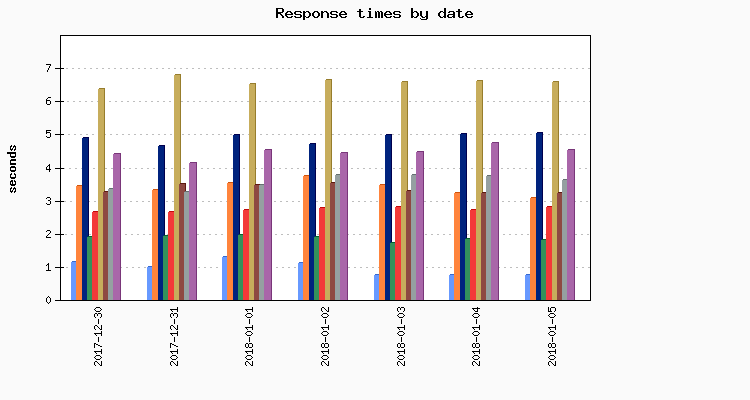
Average Response Times for January 05, 2018
Average Response Times November 21, 2017 - January 05, 2018
Hourly Average Response Times Select individual website to display: 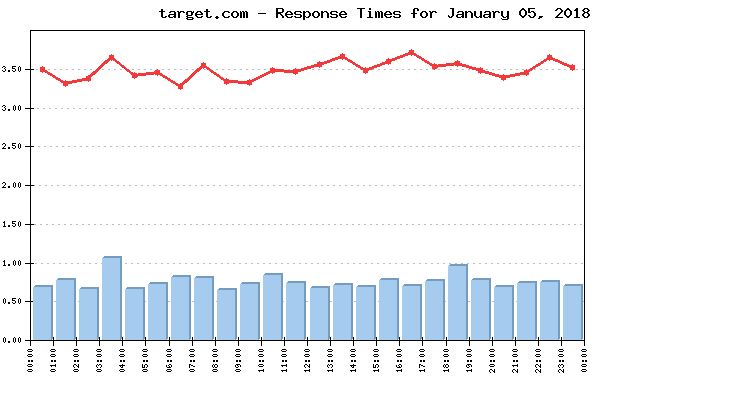 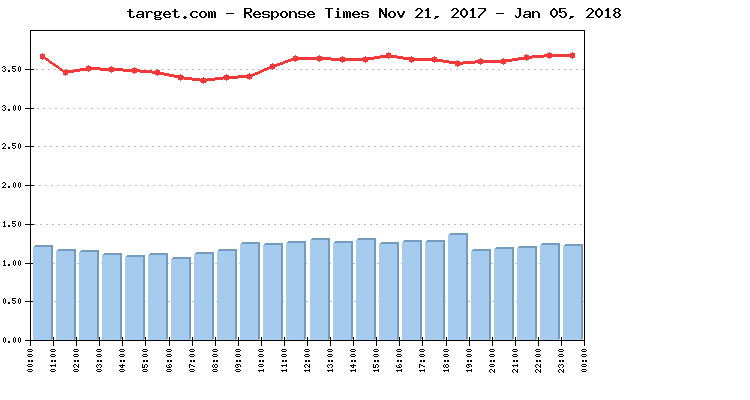
Average response times by hour for January 05, 2018
Average response times by hour November 21, 2017 - January 05, 2018
Uptime Uptime January 05, 2018
Uptime November 21, 2017 - January 05, 2018
Methodology: The 2017 Holiday Season Reports reflect a complete web transaction, representative for the End Users' interactions with a website. The reporting period covers the dates between November 21, 2016 and January 4, 2017. Performance and availability measurements are made for a typical multi-step web transaction at 15 minute monitoring interval, every day 24/7. The WebSitePulse application monitoring service is used to collect data and to create the reports. The steps in each transaction are comparable for all websites, and reflect the real online shopper experience. The simultaneous monitoring is performed from 3 US-based locations of the WebSitePulse monitoring network: Los Angeles, CA, Chicago, IL, and Washington, DC. In case of a detected malfunction or unavailability, the system performs automated error verification from 3 independent resources and only after the above procedure is performed and has returned consistent results, the detected error is confirmed, recorded, and included in the daily performance reports. In these cases, an advanced WebSitePulse exclusive feature comes into play - Forced Monitoring -, which automatically switches to a 3 minute monitoring interval for increased accuracy. About WebSitePulse: WebSitePulse is a leading provider of global, independent, and objective availability and performance monitoring of web sites, servers, network components, web applications, e-business- and email round-trip transactions. Contact: For more information about this report please contact: George T., CTO phone: 1-407-380-1600 email: Reproduction: WebSitePulse launched the Performance and Uptime Reports program to keep the general public and the Internet community informed about the performance of specific websites and the challenges their webmasters, owners and operators are facing on a daily basis, especially when the web traffic intensifies due to some special events through the year. Some of the most popular web destinations, related to each particular event, are selected for the purpose of the Reports, and data from their performance measurements is made available on the WebSitePulse public website. With the intention to broadly disseminate this information for the benefit of the Internet community, we encourage the use of this information without prior approval and under the following Terms and Conditions:
The Data from the performance measurements cannot be changed or manipulated and should be used "as is". | ||||||||||||||||||||||||||||||||||||||||||||||||||||||||||||||||||||||||||||||||||||||||||||||||||||||||||||||||||||||||||||||||||||||||||||||||||||||||||||||||||||||||||||||||||||||||||||||||||||||||||||||||||||||||||||||||||||||||||||||||||||||||||||||||||||||||||||||||||||||||||||||||||||||||||||||||||||||||||||||||||||||||||||||||||||||||||||||||||||||||||||||||||||||||||||||||||||||||||||||||||||||||||||||||||||||||||||||||||||||||||||||||||||||||||||||||||||||||||||||||||||||||||||||||||||||||||||||||||||||||||||||||||||||||||||||||||||||||||||||||||||||||||||||||||||||||||||||||||||||||||||||||||||||||||||||||||||||||||||||||||||||||||||||||||||||||||||||||||||||||||||||||||||||||||||||||||||||||||||||||||||||||||||||||||||||||||||||||||||||||||||||||||||||||||||||||||||||||||||||||||||||||||||||||||||||||||||||||||||||||||||||||||||||