
 Login
Login
Performance Tracking > 2026 Hurricane Season
WebSitePulse reports the following results from web performance measurement of the Hurricane- and disaster-related websites:
The daily Average Response time from all monitored websites was 0.491 sec.
The typical shopping transaction took the least time for redcross.org visitors - 0.139 sec., while the visitors of weather.com had to be the most patient, as the shopping transaction there took in average of 1.252 sec.
One monitored website delivered above-the-average response times for its transactions, while five of them demonstrated below-the-average daily performance.
The daily Average Uptime for the entire Group was 100%.
All websites were available with no interruptions.
Report Highlights
No events of particular importance or possible negative impact on the online visitors' interaction with the Websites included into the 2026 Hurricane Season report were detected during the reported period, and according to WebSitePulse, the Group delivered the expected levels of End-User experience and Customer satisfaction.
Please, scroll down for Detailed Reports and Charts provided by WebSitePulse:
Daily Response Times
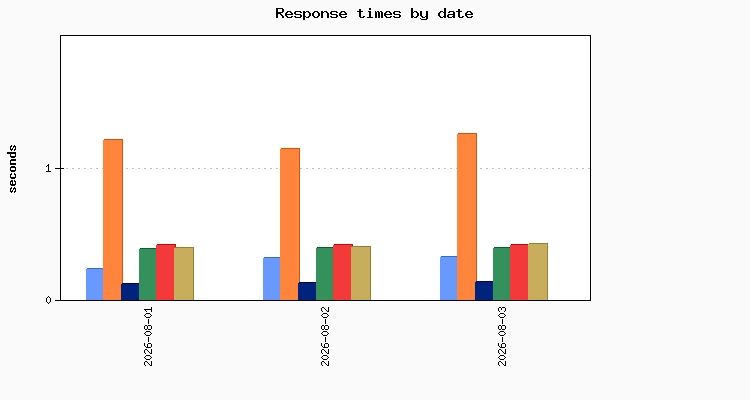
Average Response Times for August 03, 2026
Average Response Times August 01, 2026 - August 03, 2026
Hourly Average Response Times
Select individual website to display:
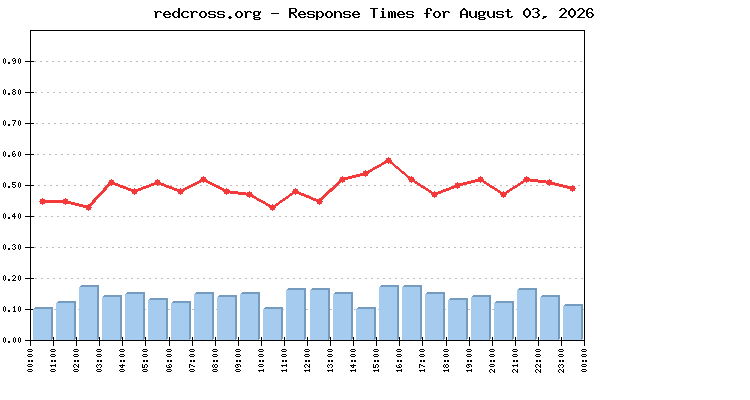
Average response times by hour for August 03, 2026
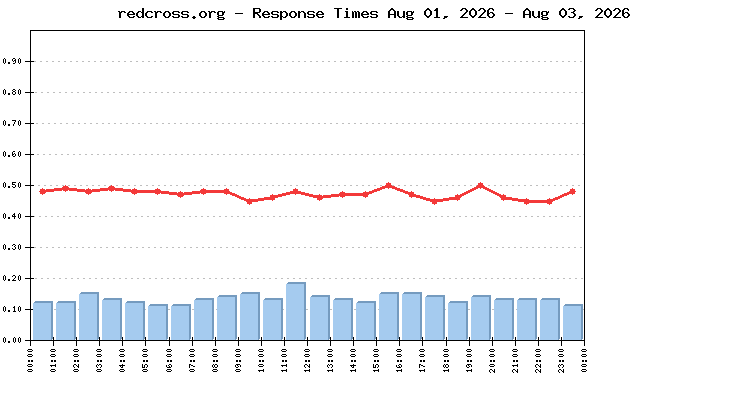
Average response times by hour August 01, 2026 - August 03, 2026
Uptime
Uptime August 03, 2026
Uptime August 01, 2026 - August 03, 2026
Methodology:
WebSitePulse Performance Reports measure Uptime and Response Time as the most important metrics for the availability and the reliability of any web-based operation. Performance measurement takes place daily, every 15 minutes during the entire Hurricane season. The WebSitePulse website monitoring service is used to collect data and to create the reports.
The simultaneous monitoring is performed from 3 US locations of the WebSitePulse monitoring network: Trumbull, CT, San Francisco, CA and Chicago, IL. In case of a detected malfunction or unavailability, the system performs automated error verification from 3 independent resources and only after the above procedure is performed and has returned consistent results, the detected error is confirmed, recorded, and included in the daily performance reports. In these cases, an advanced WebSitePulse exclusive feature comes into play - Forced Monitoring - which automatically switches to a 3 minute - monitoring interval for increased accuracy.
About WebSitePulse:
WebSitePulse is a leading provider of global, independent, and objective availability and performance monitoring of web sites, servers, network components, web applications, e-business- and email round-trip transactions.
Contact:
For more information about this report please contact:
George T., CTO
phone: 1-407-380-1600
email:
Reproduction:
WebSitePulse launched the Performance and Uptime Reports program to keep the general public and the Internet community informed about the performance of specific websites and the challenges their webmasters, owners and operators are facing on a daily basis, especially when the web traffic intensifies due to some special events through the year. Some of the most popular web destinations, related to each particular event, are selected for the purpose of the Reports, and data from their performance measurements is made available on the WebSitePulse public website.
With the intention to broadly disseminate this information for the benefit of the Internet community, we encourage the use of this information without prior approval and under the following Terms and Conditions:
The Data from the performance measurements cannot be changed or manipulated and should be used "as is".
WebSitePulse 2026 Hurricane Season Web Performance and Uptime Report Intro
The 2026 Atlantic hurricane season officially began on June 1 and will continue through November 30. This year, the National Oceanic and Atmospheric Administration (NOAA) predicts a below-normal season, with a 55% probability of below-normal activity, a 35% probability of a near-normal season, and only a 10% probability of an above-normal season.
According to NOAA's outlook, the Atlantic basin is expected to produce between 8 and 14 named storms with winds of at least 39 mph. Of these, 3 to 6 could become hurricanes with winds of at least 74 mph, including 1 to 3 major hurricanes of Category 3, 4, or 5 strength. By comparison, an average Atlantic hurricane season produces 14 named storms, 7 hurricanes, and 3 major hurricanes.
The expected development of El Niño is one of the primary factors behind the forecast for reduced Atlantic hurricane activity. El Niño typically increases vertical wind shear over the tropical Atlantic and Caribbean, making it more difficult for tropical storms to form and strengthen. However, NOAA emphasizes that a below-normal season does not eliminate the possibility of destructive hurricanes or major landfalls. Seasonal forecasts indicate the expected overall level of activity but cannot predict exactly where or when individual storms will strike.
In the Pacific, the outlook is considerably different. The Eastern Pacific hurricane season began on May 15, while the Central Pacific season began on June 1; both will continue through November 30. NOAA predicts a 70% chance of an above-normal Eastern Pacific season, with 15 to 22 named storms, 9 to 14 hurricanes, and 5 to 9 major hurricanes. The Central Pacific is also expected to experience above-normal activity, with 5 to 13 tropical cyclones of tropical-depression strength or greater.
Regardless of the total number of storms, every hurricane season presents serious risks to residents, businesses, emergency services, and online information providers. During major storms, millions of people rely on weather, emergency-management, and disaster-relief websites for forecasts, evacuation instructions, shelter information, and other critical updates. These websites must remain available and responsive even when traffic increases significantly.
The Reports reflect the most common performance criteria: response time and availability - but in-debt analytical information is also collected and stored in the WebSitePulse system for future references.
According to NOAA's outlook, the Atlantic basin is expected to produce between 8 and 14 named storms with winds of at least 39 mph. Of these, 3 to 6 could become hurricanes with winds of at least 74 mph, including 1 to 3 major hurricanes of Category 3, 4, or 5 strength. By comparison, an average Atlantic hurricane season produces 14 named storms, 7 hurricanes, and 3 major hurricanes.
The expected development of El Niño is one of the primary factors behind the forecast for reduced Atlantic hurricane activity. El Niño typically increases vertical wind shear over the tropical Atlantic and Caribbean, making it more difficult for tropical storms to form and strengthen. However, NOAA emphasizes that a below-normal season does not eliminate the possibility of destructive hurricanes or major landfalls. Seasonal forecasts indicate the expected overall level of activity but cannot predict exactly where or when individual storms will strike.
In the Pacific, the outlook is considerably different. The Eastern Pacific hurricane season began on May 15, while the Central Pacific season began on June 1; both will continue through November 30. NOAA predicts a 70% chance of an above-normal Eastern Pacific season, with 15 to 22 named storms, 9 to 14 hurricanes, and 5 to 9 major hurricanes. The Central Pacific is also expected to experience above-normal activity, with 5 to 13 tropical cyclones of tropical-depression strength or greater.
Regardless of the total number of storms, every hurricane season presents serious risks to residents, businesses, emergency services, and online information providers. During major storms, millions of people rely on weather, emergency-management, and disaster-relief websites for forecasts, evacuation instructions, shelter information, and other critical updates. These websites must remain available and responsive even when traffic increases significantly.
The Reports reflect the most common performance criteria: response time and availability - but in-debt analytical information is also collected and stored in the WebSitePulse system for future references.
| Daily Report for August 03, 2026 | See report for: |
WebSitePulse reports the following results from web performance measurement of the Hurricane- and disaster-related websites:
The daily Average Response time from all monitored websites was 0.491 sec.
| The Average Response time as measured from the US East Coast (Trumbull, CT) was: | 0.414 sec. |
| The Average Response time as measured from the US West Coast (San Francisco, CA) was: | 0.674 sec. |
| The Average Response time as measured from the US Central was (Chicago, IL): | 0.386 sec. |
| The Best Response time measured from US East Coast (Trumbull, CT): | 0.157 sec. |
| The Best Response time measured from US West Coast (San Francisco, CA): | 0.141 sec. |
| The Best Response time measured from US Central was (Chicago, IL): | 0.120 sec. |
The typical shopping transaction took the least time for redcross.org visitors - 0.139 sec., while the visitors of weather.com had to be the most patient, as the shopping transaction there took in average of 1.252 sec.
One monitored website delivered above-the-average response times for its transactions, while five of them demonstrated below-the-average daily performance.
The daily Average Uptime for the entire Group was 100%.
All websites were available with no interruptions.
Report Highlights
No events of particular importance or possible negative impact on the online visitors' interaction with the Websites included into the 2026 Hurricane Season report were detected during the reported period, and according to WebSitePulse, the Group delivered the expected levels of End-User experience and Customer satisfaction.
Please, scroll down for Detailed Reports and Charts provided by WebSitePulse:
Daily Response Times
| Legend: | ||||
| nhc.noaa.gov | weather | redcross.org | floridadisaster.org | nesdis.noaa.gov |
| tropicalstormrisk | ||||
Average Response Times for August 03, 2026
| # | Target | Trumbull | San Francisco | Chicago | Avg. resp. time |
|---|---|---|---|---|---|
| 1 | redcross.org | 0.157 | 0.141 | 0.120 | 0.139 |
| 2 | nhc.noaa.gov | 0.221 | 0.521 | 0.221 | 0.321 |
| 3 | floridadisaster.org | 0.399 | 0.455 | 0.333 | 0.396 |
| 4 | nesdis.noaa.gov | 0.346 | 0.621 | 0.289 | 0.419 |
| 5 | tropicalstormrisk.com | 0.332 | 0.556 | 0.371 | 0.420 |
| 6 | weather.com | 1.030 | 1.747 | 0.980 | 1.252 |
Average Response Times August 01, 2026 - August 03, 2026
| # | Target | Trumbull | San Francisco | Chicago | Avg. resp. time |
|---|---|---|---|---|---|
| 1 | redcross.org | 0.143 | 0.140 | 0.113 | 0.132 |
| 2 | nhc.noaa.gov | 0.229 | 0.442 | 0.204 | 0.292 |
| 3 | floridadisaster.org | 0.402 | 0.447 | 0.328 | 0.392 |
| 4 | tropicalstormrisk.com | 0.319 | 0.520 | 0.368 | 0.402 |
| 5 | nesdis.noaa.gov | 0.363 | 0.583 | 0.304 | 0.417 |
| 6 | weather.com | 0.954 | 1.626 | 1.021 | 1.200 |
Hourly Average Response Times
Select individual website to display:
| Legend: | |
| individual site response times | monitored group average response times |
Average response times by hour for August 03, 2026
| Target | Hours | |||||||||||||||||||||||
| 00 | 01 | 02 | 03 | 04 | 05 | 06 | 07 | 08 | 09 | 10 | 11 | 12 | 13 | 14 | 15 | 16 | 17 | 18 | 19 | 20 | 21 | 22 | 23 | |
| floridadisaster.org | 0.38 | 0.39 | 0.37 | 0.41 | 0.40 | 0.39 | 0.37 | 0.35 | 0.37 | 0.42 | 0.41 | 0.40 | 0.40 | 0.41 | 0.40 | 0.39 | 0.41 | 0.40 | 0.41 | 0.41 | 0.38 | 0.40 | 0.42 | 0.40 |
| nesdis.noaa.gov | 0.41 | 0.30 | 0.42 | 0.54 | 0.60 | 0.38 | 0.51 | 0.40 | 0.42 | 0.37 | 0.17 | 0.31 | 0.33 | 0.52 | 0.48 | 0.43 | 0.40 | 0.47 | 0.36 | 0.47 | 0.30 | 0.51 | 0.55 | 0.38 |
| nhc.noaa.gov | 0.28 | 0.34 | 0.31 | 0.35 | 0.30 | 0.35 | 0.30 | 0.32 | 0.32 | 0.29 | 0.27 | 0.29 | 0.31 | 0.48 | 0.30 | 0.34 | 0.31 | 0.27 | 0.36 | 0.31 | 0.30 | 0.35 | 0.39 | 0.26 |
| redcross.org | 0.10 | 0.12 | 0.17 | 0.14 | 0.15 | 0.13 | 0.12 | 0.15 | 0.14 | 0.15 | 0.10 | 0.16 | 0.16 | 0.15 | 0.10 | 0.17 | 0.17 | 0.15 | 0.13 | 0.14 | 0.12 | 0.16 | 0.14 | 0.11 |
| tropicalstormrisk | 0.42 | 0.48 | 0.39 | 0.53 | 0.39 | 0.67 | 0.39 | 0.37 | 0.45 | 0.37 | 0.44 | 0.40 | 0.50 | 0.39 | 0.39 | 0.38 | 0.38 | 0.39 | 0.40 | 0.38 | 0.40 | 0.39 | 0.38 | 0.39 |
| weather | 1.09 | 1.08 | 0.92 | 1.10 | 1.04 | 1.13 | 1.18 | 1.52 | 1.19 | 1.25 | 1.19 | 1.30 | 1.02 | 1.18 | 1.55 | 1.75 | 1.43 | 1.15 | 1.31 | 1.41 | 1.34 | 1.31 | 1.20 | 1.42 |
Average response times by hour August 01, 2026 - August 03, 2026
| Target | Hours | |||||||||||||||||||||||
| 00 | 01 | 02 | 03 | 04 | 05 | 06 | 07 | 08 | 09 | 10 | 11 | 12 | 13 | 14 | 15 | 16 | 17 | 18 | 19 | 20 | 21 | 22 | 23 | |
| floridadisaster.org | 0.37 | 0.40 | 0.38 | 0.41 | 0.39 | 0.37 | 0.37 | 0.40 | 0.39 | 0.40 | 0.40 | 0.38 | 0.39 | 0.39 | 0.40 | 0.39 | 0.40 | 0.38 | 0.39 | 0.39 | 0.39 | 0.42 | 0.39 | 0.44 |
| nesdis.noaa.gov | 0.44 | 0.44 | 0.53 | 0.45 | 0.46 | 0.46 | 0.54 | 0.41 | 0.53 | 0.42 | 0.35 | 0.33 | 0.38 | 0.46 | 0.36 | 0.36 | 0.36 | 0.41 | 0.37 | 0.49 | 0.33 | 0.34 | 0.39 | 0.38 |
| nhc.noaa.gov | 0.29 | 0.29 | 0.29 | 0.28 | 0.26 | 0.29 | 0.27 | 0.29 | 0.25 | 0.25 | 0.24 | 0.28 | 0.30 | 0.34 | 0.29 | 0.32 | 0.34 | 0.33 | 0.34 | 0.29 | 0.28 | 0.30 | 0.31 | 0.30 |
| redcross.org | 0.12 | 0.12 | 0.15 | 0.13 | 0.12 | 0.11 | 0.11 | 0.13 | 0.14 | 0.15 | 0.13 | 0.18 | 0.14 | 0.13 | 0.12 | 0.15 | 0.15 | 0.14 | 0.12 | 0.14 | 0.13 | 0.13 | 0.13 | 0.11 |
| tropicalstormrisk | 0.40 | 0.45 | 0.39 | 0.42 | 0.38 | 0.57 | 0.38 | 0.38 | 0.40 | 0.38 | 0.42 | 0.43 | 0.42 | 0.38 | 0.38 | 0.38 | 0.38 | 0.38 | 0.39 | 0.38 | 0.40 | 0.39 | 0.39 | 0.39 |
| weather | 1.25 | 1.24 | 1.17 | 1.23 | 1.25 | 1.09 | 1.15 | 1.27 | 1.20 | 1.13 | 1.21 | 1.31 | 1.13 | 1.11 | 1.27 | 1.38 | 1.21 | 1.05 | 1.17 | 1.29 | 1.21 | 1.15 | 1.10 | 1.24 |
Uptime
Uptime August 03, 2026
| # | Target | Trumbull | San Francisco | Chicago | Avg. uptime |
|---|---|---|---|---|---|
| 1 | nhc.noaa.gov | 100.000% | 100.000% | 100.000% | 100.000% |
| 2 | weather.com | 100.000% | 100.000% | 100.000% | 100.000% |
| 3 | redcross.org | 100.000% | 100.000% | 100.000% | 100.000% |
| 4 | floridadisaster.org | 100.000% | 100.000% | 100.000% | 100.000% |
| 5 | nesdis.noaa.gov | 100.000% | 100.000% | 100.000% | 100.000% |
| 6 | tropicalstormrisk.com | 100.000% | 100.000% | 100.000% | 100.000% |
Uptime August 01, 2026 - August 03, 2026
| # | Target | Trumbull | San Francisco | Chicago | Avg. uptime |
|---|---|---|---|---|---|
| 1 | tropicalstormrisk.com | 100.000% | 100.000% | 100.000% | 100.000% |
| 2 | nhc.noaa.gov | 100.000% | 100.000% | 100.000% | 100.000% |
| 3 | redcross.org | 100.000% | 100.000% | 100.000% | 100.000% |
| 4 | nesdis.noaa.gov | 100.000% | 100.000% | 100.000% | 100.000% |
| 5 | weather.com | 100.000% | 100.000% | 100.000% | 100.000% |
| 6 | floridadisaster.org | 100.000% | 100.000% | 100.000% | 100.000% |
Methodology:
WebSitePulse Performance Reports measure Uptime and Response Time as the most important metrics for the availability and the reliability of any web-based operation. Performance measurement takes place daily, every 15 minutes during the entire Hurricane season. The WebSitePulse website monitoring service is used to collect data and to create the reports.
The simultaneous monitoring is performed from 3 US locations of the WebSitePulse monitoring network: Trumbull, CT, San Francisco, CA and Chicago, IL. In case of a detected malfunction or unavailability, the system performs automated error verification from 3 independent resources and only after the above procedure is performed and has returned consistent results, the detected error is confirmed, recorded, and included in the daily performance reports. In these cases, an advanced WebSitePulse exclusive feature comes into play - Forced Monitoring - which automatically switches to a 3 minute - monitoring interval for increased accuracy.
About WebSitePulse:
WebSitePulse is a leading provider of global, independent, and objective availability and performance monitoring of web sites, servers, network components, web applications, e-business- and email round-trip transactions.
Contact:
For more information about this report please contact:
George T., CTO
phone: 1-407-380-1600
email:
Reproduction:
WebSitePulse launched the Performance and Uptime Reports program to keep the general public and the Internet community informed about the performance of specific websites and the challenges their webmasters, owners and operators are facing on a daily basis, especially when the web traffic intensifies due to some special events through the year. Some of the most popular web destinations, related to each particular event, are selected for the purpose of the Reports, and data from their performance measurements is made available on the WebSitePulse public website.
With the intention to broadly disseminate this information for the benefit of the Internet community, we encourage the use of this information without prior approval and under the following Terms and Conditions:
- WebSitePulse should be referred as the "Source" of the information;
- WebSitePulse should be acknowledged as the owner of the copyrights of the information in the Reports;
- The texts of the Reports could be changed or altered to better suit the needs and the style of the publisher without prior notice to WebSitePulse. However, the integrity and the meaning of the information should be preserved;
The Data from the performance measurements cannot be changed or manipulated and should be used "as is".
