
Performance Tracking > 2016 Holiday Season
The holiday season is upon us once again. And while for some a strong online sales season can make the whole year a success, for others weak holiday sales can spell disaster.
To nobody's surprise, the web sales are set to continue their ruthless march upward this holiday season. Digital sales are expected to hit $94.71 billion this Christmas period, according to research firm eMarketer.
That would take the online sales share of total holiday season sales past the 10% mark for the first time, which can be considered as a major milestone for online retailers. For reference, last holiday season, more shoppers went online than to stores over Thanksgiving weekend, which is the kickoff to the busiest shopping period of the year.
As usual your online's store reliability is as good as your uptime or downtime (whichever you prefer) and here, at WebSitePulse, we are going to measure just that and then some.
Our Holiday Season Reports reflect a typical online purchase transaction, like selecting an item, adding it to the shopping cart and checkout, representative for the End Users' interactions with a website. Measurements of the multi-step transactions are made every 15 minutes, simultaneously from 3 different US cities. The information from the report will provide insight into the End Users' shopping experience, the reliability of the IT infrastructure of the selected Internet retailers, and their estimated losses in case of downtime and failure of critical websites, web pages, web systems, network devices, and web applications.
WebSitePulse reports the following results from web performance measurement of the websites participating in the the Holiday Retail Performance and Uptime Report:
The daily Average Response time from all monitored websites was 2.898 sec.
The typical shopping transaction took the least time for kmart.com visitors - 0.968 sec., while the visitors of hallmark.com had to be the most patient, as the shopping transaction there took in average of 5.676 sec.
Four of the monitored websites delivered above-the-average response times for their transactions, while seven of them demonstrated below-the-average daily performance.
The daily average uptime for the entire Group was 99.95%.
Nine websites were available with no interruptions - 100%.
Nine websites' availability was above the average, while two sites dragged the average down with below-the-average availability.
Report Highlights
No events of particular importance or possible negative impact on the online visitors' interaction with the Websites included into the 2016 Holiday Season report were detected during the reported period, and according to WebSitePulse, the Group delivered the expected levels of End-User experience and Customer satisfaction.
Please, scroll down for Detailed Reports and Charts provided by WebSitePulse:
Daily Response Times
Average Response Times for January 04, 2017
Average Response Times November 21, 2016 - January 04, 2017
Hourly Average Response Times
Select individual website to display:
Average response times by hour for January 04, 2017
Average response times by hour November 21, 2016 - January 04, 2017
Uptime
Uptime January 04, 2017
Uptime November 21, 2016 - January 04, 2017
Methodology:
The 2016 Holiday Season Reports reflect a complete web transaction, representative for the End Users' interactions with a website. The reporting period covers the dates between November 21, 2016 and January 4, 2017. Performance and availability measurements are made for a typical multi-step web transaction at 15 minute monitoring interval, every day 24/7. The WebSitePulse application monitoring service is used to collect data and to create the reports.
The steps in each transaction are comparable for all websites, and reflect the real online shopper experience. The simultaneous monitoring is performed from 3 US-based locations of the WebSitePulse monitoring network: Los Angeles, CA, Chicago, IL, and Washington, DC. In case of a detected malfunction or unavailability, the system performs automated error verification from 3 independent resources and only after the above procedure is performed and has returned consistent results, the detected error is confirmed, recorded, and included in the daily performance reports. In these cases, an advanced WebSitePulse exclusive feature comes into play - Forced Monitoring -, which automatically switches to a 3 minute monitoring interval for increased accuracy.
About WebSitePulse:
WebSitePulse is a leading provider of global, independent, and objective availability and performance monitoring of web sites, servers, network components, web applications, e-business- and email round-trip transactions.
Contact:
For more information about this report please contact:
George T., CTO
phone: 1-407-380-1600
email:
Reproduction:
WebSitePulse launched the Performance and Uptime Reports program to keep the general public and the Internet community informed about the performance of specific websites and the challenges their webmasters, owners and operators are facing on a daily basis, especially when the web traffic intensifies due to some special events through the year. Some of the most popular web destinations, related to each particular event, are selected for the purpose of the Reports, and data from their performance measurements is made available on the WebSitePulse public website.
With the intention to broadly disseminate this information for the benefit of the Internet community, we encourage the use of this information without prior approval and under the following Terms and Conditions:
The Data from the performance measurements cannot be changed or manipulated and should be used "as is".
WebSitePulse 2016 Holiday Retail Performance and Uptime Report
The holiday season is upon us once again. And while for some a strong online sales season can make the whole year a success, for others weak holiday sales can spell disaster.
To nobody's surprise, the web sales are set to continue their ruthless march upward this holiday season. Digital sales are expected to hit $94.71 billion this Christmas period, according to research firm eMarketer.
That would take the online sales share of total holiday season sales past the 10% mark for the first time, which can be considered as a major milestone for online retailers. For reference, last holiday season, more shoppers went online than to stores over Thanksgiving weekend, which is the kickoff to the busiest shopping period of the year.
As usual your online's store reliability is as good as your uptime or downtime (whichever you prefer) and here, at WebSitePulse, we are going to measure just that and then some.
Our Holiday Season Reports reflect a typical online purchase transaction, like selecting an item, adding it to the shopping cart and checkout, representative for the End Users' interactions with a website. Measurements of the multi-step transactions are made every 15 minutes, simultaneously from 3 different US cities. The information from the report will provide insight into the End Users' shopping experience, the reliability of the IT infrastructure of the selected Internet retailers, and their estimated losses in case of downtime and failure of critical websites, web pages, web systems, network devices, and web applications.
| Daily Report for January 04, 2017 | See report for: |
WebSitePulse reports the following results from web performance measurement of the websites participating in the the Holiday Retail Performance and Uptime Report:
The daily Average Response time from all monitored websites was 2.898 sec.
| The Average Response time as measured from the US East Coast (Washington DC) was: | 2.713 sec. |
| The Average Response time as measured from the US West Coast (Los Angeles, CA) was: | 3.254 sec. |
| The Average Response time as measured from the US Central was (Chicago, IL): | 2.726 sec. |
| The Best Response time measured from US East Coast (Washington DC): | 0.782 sec. |
| The Best Response time measured from US West Coast (Los Angeles, CA): | 1.006 sec. |
| The Best Response time measured from US Central was (Chicago, IL): | 1.096 sec. |
The typical shopping transaction took the least time for kmart.com visitors - 0.968 sec., while the visitors of hallmark.com had to be the most patient, as the shopping transaction there took in average of 5.676 sec.
Four of the monitored websites delivered above-the-average response times for their transactions, while seven of them demonstrated below-the-average daily performance.
The daily average uptime for the entire Group was 99.95%.
| The Average Uptime as measured from the US East Coast (Washington DC) was: | 99.92% |
| The Average Uptime as measured from the US West Coast (Los Angeles, CA) was: | 99.96% |
| The Average Uptime as measured from the US Central (Chicago, IL): | 99.96% |
Nine websites were available with no interruptions - 100%.
Nine websites' availability was above the average, while two sites dragged the average down with below-the-average availability.
Report Highlights
No events of particular importance or possible negative impact on the online visitors' interaction with the Websites included into the 2016 Holiday Season report were detected during the reported period, and according to WebSitePulse, the Group delivered the expected levels of End-User experience and Customer satisfaction.
Please, scroll down for Detailed Reports and Charts provided by WebSitePulse:
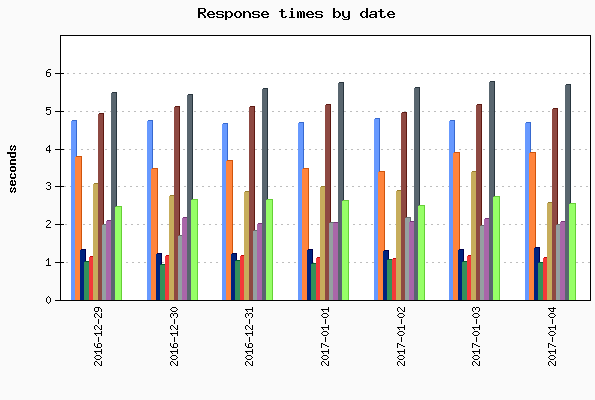
Daily Response Times
| Legend: | |||||
| amazon | bestbuy | target | kmart | sears | |
| toysrus | walmart | qvc | tigerdirect | hallmark | jcpenney |
Average Response Times for January 04, 2017
| # | Target | Los Angeles | Chicago | Washington | Avg. resp. time |
|---|---|---|---|---|---|
| 1 | kmart.com | 1.006 | 1.116 | 0.782 | 0.968 |
| 2 | sears.com | 1.458 | 1.096 | 0.806 | 1.120 |
| 3 | target.com | 1.456 | 1.522 | 1.152 | 1.377 |
| 4 | qvc.com | 2.484 | 1.928 | 1.497 | 1.970 |
| 5 | tigerdirect.com | 2.119 | 1.763 | 2.286 | 2.056 |
| 6 | jcpenney.com | 2.671 | 2.544 | 2.381 | 2.532 |
| 7 | toysrus.com | 2.217 | 2.505 | 2.986 | 2.569 |
| 8 | bestbuy.com | 3.971 | 3.960 | 3.707 | 3.879 |
| 9 | amazon.com | 6.332 | 4.108 | 3.626 | 4.689 |
| 10 | walmart.com | 5.659 | 4.845 | 4.609 | 5.038 |
| 11 | hallmark.com | 6.423 | 4.598 | 6.007 | 5.676 |
Average Response Times November 21, 2016 - January 04, 2017
| # | Target | Los Angeles | Chicago | Washington | Avg. resp. time |
|---|---|---|---|---|---|
| 1 | kmart.com | 1.133 | 1.137 | 0.957 | 1.076 |
| 2 | sears.com | 1.490 | 1.152 | 0.937 | 1.193 |
| 3 | target.com | 1.327 | 1.264 | 1.096 | 1.229 |
| 4 | qvc.com | 2.250 | 1.788 | 1.623 | 1.887 |
| 5 | tigerdirect.com | 2.265 | 1.911 | 2.443 | 2.206 |
| 6 | jcpenney.com | 2.777 | 2.444 | 2.378 | 2.533 |
| 7 | toysrus.com | 2.225 | 2.855 | 2.938 | 2.673 |
| 8 | bestbuy.com | 3.498 | 3.748 | 3.528 | 3.591 |
| 9 | walmart.com | 5.362 | 4.378 | 4.615 | 4.785 |
| 10 | amazon.com | 6.939 | 4.342 | 3.727 | 5.002 |
| 11 | hallmark.com | 6.132 | 4.492 | 5.785 | 5.470 |
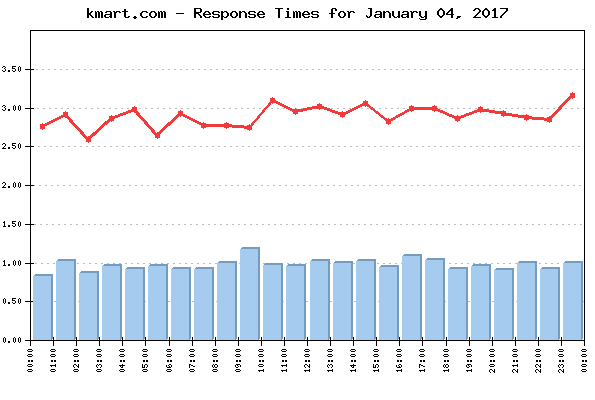
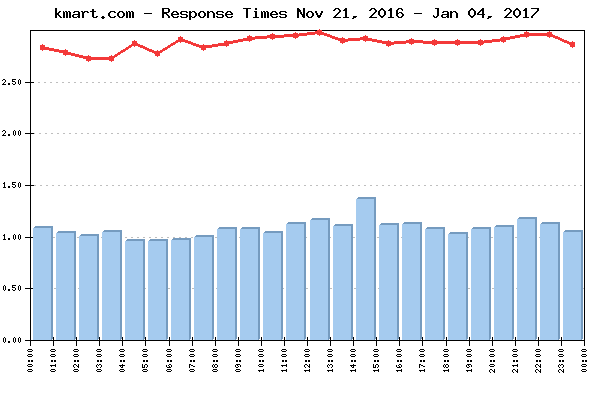
Hourly Average Response Times
Select individual website to display:
| Legend: | |
| individual site response times | monitored group average response times |
Average response times by hour for January 04, 2017
| Target | Hours | |||||||||||||||||||||||
| 00 | 01 | 02 | 03 | 04 | 05 | 06 | 07 | 08 | 09 | 10 | 11 | 12 | 13 | 14 | 15 | 16 | 17 | 18 | 19 | 20 | 21 | 22 | 23 | |
| amazon | 4.72 | 4.69 | 4.76 | 4.66 | 4.67 | 4.68 | 4.64 | 4.65 | 4.64 | 4.71 | 4.65 | 4.66 | 4.68 | 4.68 | 4.59 | 4.79 | 4.67 | 4.59 | 4.78 | 4.67 | 4.69 | 4.66 | 4.86 | 4.74 |
| bestbuy | 3.31 | 3.67 | 2.87 | 3.64 | 3.63 | 2.98 | 3.72 | 3.03 | 3.26 | 4.64 | 3.47 | 4.03 | 5.02 | 4.34 | 3.78 | 3.58 | 4.00 | 4.06 | 3.99 | 4.12 | 3.81 | 4.29 | 4.08 | 5.81 |
| hallmark | 5.58 | 5.88 | 5.91 | 5.93 | 6.14 | 5.99 | 6.57 | 5.78 | 5.35 | 5.44 | 5.37 | 5.45 | 6.07 | 5.76 | 5.54 | 5.46 | 5.43 | 5.33 | 5.40 | 5.67 | 5.53 | 5.53 | 5.22 | 5.88 |
| jcpenney | 2.24 | 2.40 | 2.49 | 4.37 | 3.98 | 2.43 | 2.12 | 2.22 | 2.21 | 2.20 | 2.64 | 2.30 | 2.20 | 2.37 | 2.93 | 2.33 | 2.57 | 2.55 | 2.21 | 2.46 | 2.29 | 2.42 | 2.40 | 2.46 |
| kmart | 0.83 | 1.02 | 0.86 | 0.95 | 0.92 | 0.96 | 0.92 | 0.92 | 1.00 | 1.17 | 0.97 | 0.95 | 1.02 | 0.99 | 1.02 | 0.94 | 1.08 | 1.03 | 0.91 | 0.95 | 0.90 | 1.00 | 0.92 | 1.00 |
| qvc | 1.52 | 1.84 | 1.35 | 1.52 | 2.05 | 1.63 | 1.67 | 1.27 | 1.62 | 1.42 | 2.24 | 2.57 | 1.88 | 2.30 | 1.69 | 2.02 | 3.19 | 2.08 | 2.29 | 2.80 | 1.98 | 2.43 | 1.76 | 2.19 |
| sears | 1.01 | 1.04 | 1.00 | 1.11 | 1.02 | 1.05 | 1.05 | 0.98 | 1.03 | 1.13 | 1.26 | 1.09 | 1.26 | 1.05 | 1.15 | 1.22 | 1.12 | 1.12 | 1.58 | 1.12 | 1.13 | 1.15 | 1.11 | 1.10 |
| target | 1.09 | 1.57 | 1.05 | 1.09 | 1.15 | 1.06 | 1.08 | 1.16 | 3.02 | 1.19 | 1.32 | 1.26 | 1.37 | 1.33 | 1.42 | 1.42 | 1.44 | 1.45 | 1.48 | 1.31 | 1.62 | 1.44 | 1.37 | 1.33 |
| tigerdirect | 1.94 | 1.85 | 1.92 | 2.04 | 2.00 | 1.88 | 1.72 | 2.40 | 1.77 | 2.10 | 2.22 | 2.20 | 2.21 | 1.90 | 1.93 | 2.40 | 1.94 | 2.23 | 2.25 | 2.22 | 2.41 | 2.08 | 1.77 | 1.97 |
| toysrus | 2.96 | 2.12 | 2.01 | 2.15 | 2.05 | 2.02 | 4.69 | 3.31 | 2.58 | 2.24 | 2.29 | 2.76 | 2.97 | 2.50 | 4.15 | 2.67 | 2.31 | 2.15 | 2.26 | 2.30 | 2.07 | 2.16 | 2.45 | 2.46 |
| walmart | 5.19 | 6.01 | 4.42 | 4.09 | 5.13 | 4.49 | 4.06 | 4.86 | 4.07 | 3.98 | 7.61 | 5.22 | 4.61 | 4.81 | 5.49 | 4.22 | 5.24 | 6.29 | 4.35 | 5.18 | 5.80 | 4.55 | 5.43 | 5.80 |
Average response times by hour November 21, 2016 - January 04, 2017
| Target | Hours | |||||||||||||||||||||||
| 00 | 01 | 02 | 03 | 04 | 05 | 06 | 07 | 08 | 09 | 10 | 11 | 12 | 13 | 14 | 15 | 16 | 17 | 18 | 19 | 20 | 21 | 22 | 23 | |
| amazon | 4.97 | 4.93 | 4.96 | 5.00 | 5.07 | 5.09 | 5.08 | 5.02 | 4.96 | 5.01 | 5.03 | 5.00 | 5.00 | 4.96 | 4.98 | 4.93 | 5.05 | 5.10 | 5.02 | 4.99 | 4.98 | 4.98 | 4.97 | 4.97 |
| bestbuy | 3.46 | 3.54 | 3.22 | 2.98 | 2.93 | 2.92 | 3.08 | 3.41 | 3.56 | 3.70 | 4.04 | 4.02 | 3.88 | 3.81 | 3.72 | 3.79 | 3.77 | 3.67 | 3.59 | 3.78 | 3.77 | 3.78 | 4.02 | 3.74 |
| hallmark | 5.29 | 5.44 | 5.59 | 5.90 | 5.82 | 5.77 | 6.04 | 5.62 | 5.53 | 5.43 | 5.36 | 5.40 | 5.37 | 5.21 | 5.26 | 5.38 | 5.35 | 5.26 | 5.48 | 5.25 | 5.39 | 5.38 | 5.41 | 5.33 |
| jcpenney | 2.36 | 2.34 | 2.38 | 2.28 | 3.78 | 3.02 | 2.29 | 2.28 | 2.53 | 2.64 | 2.50 | 2.46 | 2.46 | 2.47 | 2.47 | 2.45 | 2.35 | 2.47 | 2.48 | 2.54 | 2.53 | 2.53 | 2.69 | 2.50 |
| kmart | 1.08 | 1.04 | 1.01 | 1.05 | 0.96 | 0.96 | 0.97 | 1.00 | 1.07 | 1.07 | 1.04 | 1.12 | 1.16 | 1.10 | 1.36 | 1.11 | 1.12 | 1.07 | 1.03 | 1.07 | 1.09 | 1.17 | 1.12 | 1.05 |
| qvc | 1.84 | 1.76 | 1.74 | 1.62 | 1.56 | 1.56 | 1.64 | 1.60 | 1.74 | 1.84 | 2.00 | 2.01 | 1.97 | 2.03 | 1.91 | 1.91 | 1.94 | 1.99 | 2.09 | 2.06 | 2.13 | 2.25 | 2.10 | 2.01 |
| sears | 1.19 | 1.20 | 1.17 | 1.20 | 1.12 | 1.11 | 1.10 | 1.15 | 1.18 | 1.22 | 1.18 | 1.22 | 1.36 | 1.22 | 1.38 | 1.16 | 1.22 | 1.14 | 1.18 | 1.16 | 1.12 | 1.22 | 1.21 | 1.21 |
| target | 1.25 | 1.13 | 1.01 | 1.03 | 1.03 | 1.01 | 0.99 | 1.14 | 1.14 | 1.16 | 1.31 | 1.36 | 1.34 | 1.37 | 1.27 | 1.34 | 1.31 | 1.23 | 1.24 | 1.31 | 1.41 | 1.45 | 1.41 | 1.25 |
| tigerdirect | 2.63 | 2.09 | 2.01 | 2.04 | 2.09 | 2.08 | 2.08 | 2.10 | 2.06 | 2.12 | 2.11 | 2.29 | 2.82 | 2.37 | 2.19 | 2.19 | 2.31 | 2.28 | 2.19 | 2.13 | 2.13 | 2.17 | 2.19 | 2.29 |
| toysrus | 2.55 | 2.37 | 2.40 | 2.34 | 2.42 | 2.32 | 3.93 | 3.19 | 2.99 | 3.06 | 2.79 | 2.73 | 2.69 | 2.48 | 2.68 | 2.50 | 2.51 | 2.69 | 2.56 | 2.69 | 2.54 | 2.80 | 2.58 | 2.35 |
| walmart | 4.67 | 4.87 | 4.60 | 4.60 | 4.74 | 4.75 | 4.83 | 4.70 | 4.76 | 4.84 | 4.97 | 4.81 | 4.72 | 4.90 | 4.85 | 4.79 | 4.87 | 4.76 | 4.82 | 4.68 | 4.90 | 4.83 | 4.81 | 4.75 |
Uptime
Uptime January 04, 2017
| # | Target | Los Angeles | Chicago | Washington | Avg. uptime |
|---|---|---|---|---|---|
| 1 | tigerdirect.com | 100.000% | 100.000% | 100.000% | 100.000% |
| 2 | hallmark.com | 100.000% | 100.000% | 100.000% | 100.000% |
| 3 | jcpenney.com | 100.000% | 100.000% | 100.000% | 100.000% |
| 4 | amazon.com | 100.000% | 100.000% | 100.000% | 100.000% |
| 5 | toysrus.com | 100.000% | 100.000% | 100.000% | 100.000% |
| 6 | kmart.com | 100.000% | 100.000% | 100.000% | 100.000% |
| 7 | sears.com | 100.000% | 100.000% | 100.000% | 100.000% |
| 8 | bestbuy.com | 100.000% | 100.000% | 100.000% | 100.000% |
| 9 | target.com | 100.000% | 100.000% | 100.000% | 100.000% |
| 10 | qvc.com | 100.000% | 100.000% | 99.820% | 99.940% |
| 11 | walmart.com | 99.530% | 99.520% | 99.320% | 99.457% |
Uptime November 21, 2016 - January 04, 2017
| # | Target | Los Angeles | Chicago | Washington | Avg. uptime |
|---|---|---|---|---|---|
| 1 | target.com | 99.995% | 100.000% | 100.000% | 99.998% |
| 2 | tigerdirect.com | 99.995% | 99.995% | 100.000% | 99.997% |
| 3 | toysrus.com | 99.990% | 99.995% | 100.000% | 99.995% |
| 4 | jcpenney.com | 100.000% | 99.989% | 99.996% | 99.995% |
| 5 | hallmark.com | 99.986% | 99.995% | 99.989% | 99.990% |
| 6 | bestbuy.com | 99.996% | 99.979% | 99.991% | 99.988% |
| 7 | sears.com | 99.976% | 99.984% | 99.976% | 99.979% |
| 8 | qvc.com | 99.980% | 99.972% | 99.980% | 99.977% |
| 9 | kmart.com | 99.979% | 99.976% | 99.961% | 99.972% |
| 10 | amazon.com | 99.716% | 99.734% | 99.754% | 99.735% |
| 11 | walmart.com | 99.907% | 99.276% | 99.164% | 99.449% |
Methodology:
The 2016 Holiday Season Reports reflect a complete web transaction, representative for the End Users' interactions with a website. The reporting period covers the dates between November 21, 2016 and January 4, 2017. Performance and availability measurements are made for a typical multi-step web transaction at 15 minute monitoring interval, every day 24/7. The WebSitePulse application monitoring service is used to collect data and to create the reports.
The steps in each transaction are comparable for all websites, and reflect the real online shopper experience. The simultaneous monitoring is performed from 3 US-based locations of the WebSitePulse monitoring network: Los Angeles, CA, Chicago, IL, and Washington, DC. In case of a detected malfunction or unavailability, the system performs automated error verification from 3 independent resources and only after the above procedure is performed and has returned consistent results, the detected error is confirmed, recorded, and included in the daily performance reports. In these cases, an advanced WebSitePulse exclusive feature comes into play - Forced Monitoring -, which automatically switches to a 3 minute monitoring interval for increased accuracy.
About WebSitePulse:
WebSitePulse is a leading provider of global, independent, and objective availability and performance monitoring of web sites, servers, network components, web applications, e-business- and email round-trip transactions.
Contact:
For more information about this report please contact:
George T., CTO
phone: 1-407-380-1600
email:
Reproduction:
WebSitePulse launched the Performance and Uptime Reports program to keep the general public and the Internet community informed about the performance of specific websites and the challenges their webmasters, owners and operators are facing on a daily basis, especially when the web traffic intensifies due to some special events through the year. Some of the most popular web destinations, related to each particular event, are selected for the purpose of the Reports, and data from their performance measurements is made available on the WebSitePulse public website.
With the intention to broadly disseminate this information for the benefit of the Internet community, we encourage the use of this information without prior approval and under the following Terms and Conditions:
- WebSitePulse should be referred as the "Source" of the information;
- WebSitePulse should be acknowledged as the owner of the copyrights of the information in the Reports;
- The texts of the Reports could be changed or altered to better suit the needs and the style of the publisher without prior notice to WebSitePulse. However, the integrity and the meaning of the information should be preserved;
The Data from the performance measurements cannot be changed or manipulated and should be used "as is".