
Performance Tracking > 2019 Hurricane Season
WebSitePulse reports the following results from web performance measurement of the Hurricane- and disaster-related websites:
The daily Average Response time from all monitored websites was 0.745 sec.
The typical shopping transaction took the least time for nhc.noaa.gov visitors - 0.216 sec., while the visitors of weather.com had to be the most patient, as the shopping transaction there took in average of 1.666 sec.
Two of the monitored websites delivered above-the-average response times for their transactions, while three of them demonstrated below-the-average daily performance.
The daily Average Uptime for the entire Group was 100%.
All websites were available with no interruptions.
Report Highlights
No events of particular importance or possible negative impact on the online visitors' interaction with the Websites included into the 2019 Hurricane Season report were detected during the reported period, and according to WebSitePulse, the Group delivered the expected levels of End-User experience and Customer satisfaction.
Please, scroll down for Detailed Reports and Charts provided by WebSitePulse:
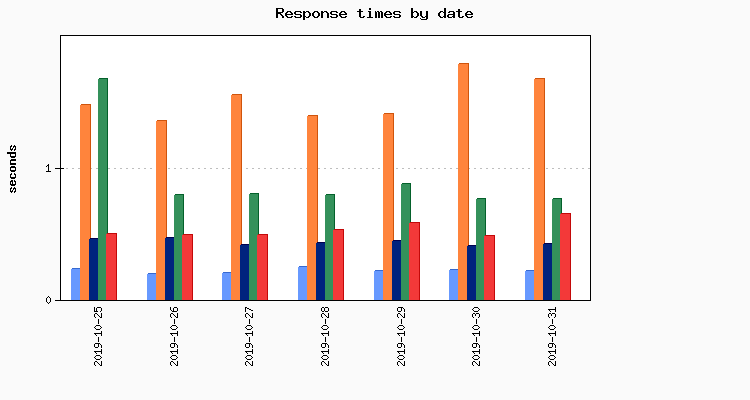
Daily Response Times
Average Response Times for October 31, 2019
Average Response Times August 19, 2019 - October 31, 2019
Hourly Average Response Times
Select individual website to display:
Average response times by hour for October 31, 2019
Average response times by hour August 19, 2019 - October 31, 2019
Uptime
Uptime October 31, 2019
Uptime August 19, 2019 - October 31, 2019
Methodology:
WebSitePulse Performance Reports measure Uptime and Response Time as the most important metrics for the availability and the reliability of any web-based operation. Performance measurement takes place daily, every 15 minutes during the entire Hurricane season. The WebSitePulse website monitoring service is used to collect data and to create the reports.
The simultaneous monitoring is performed from 3 US locations of the WebSitePulse monitoring network: Trumbull, CT, San Francisco, CA and Chicago, IL. In case of a detected malfunction or unavailability, the system performs automated error verification from 3 independent resources and only after the above procedure is performed and has returned consistent results, the detected error is confirmed, recorded, and included in the daily performance reports. In these cases, an advanced WebSitePulse exclusive feature comes into play - Forced Monitoring - which automatically switches to a 3 minute - monitoring interval for increased accuracy.
About WebSitePulse:
WebSitePulse is a leading provider of global, independent, and objective availability and performance monitoring of web sites, servers, network components, web applications, e-business- and email round-trip transactions.
Contact:
For more information about this report please contact:
George T., CTO
phone: 1-407-380-1600
email:
Reproduction:
WebSitePulse launched the Performance and Uptime Reports program to keep the general public and the Internet community informed about the performance of specific websites and the challenges their webmasters, owners and operators are facing on a daily basis, especially when the web traffic intensifies due to some special events through the year. Some of the most popular web destinations, related to each particular event, are selected for the purpose of the Reports, and data from their performance measurements is made available on the WebSitePulse public website.
With the intention to broadly disseminate this information for the benefit of the Internet community, we encourage the use of this information without prior approval and under the following Terms and Conditions:
The Data from the performance measurements cannot be changed or manipulated and should be used "as is".
WebSitePulse 2019 Hurricane Season Web Performance and Uptime Report
The hurricane season 2019 is now upon us. It is usually that distinct time of year when most tropical cyclones are expected to develop across the northern Atlantic Ocean. Whenever hurricane season is mentioned in the U.S. usually refers to the Atlantic Hurricane Season, whose storms most commonly affect the North American continent. It is an ongoing event and officially ends on November 30, 2019, however, in the past the season was defined as a shorter time frame.
According to Colorado State University’s (CSU) Tropical Meteorology Project, as from August the 5th 14 named storms, seven hurricanes, two major hurricanes and an ACE of 105 are expected until the end of this year’s Atlantic Hurricane Season.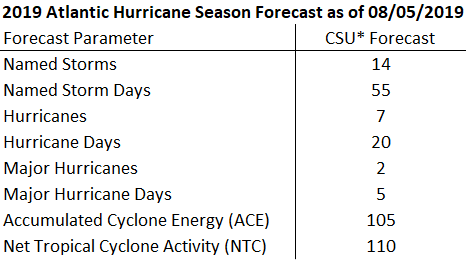 The 2019 Pacific hurricane season has also started. On May 25, 2019, the National Oceanic and Atmospheric Administration released its annual forecast, predicting a 90% chance of a near- to an above-average season in both the Eastern and Central Pacific basins, with a total of 14–21 named storms, 6–13 hurricanes, and 3–9 major hurricanes. Similar is the Servicio Meteorológico Nacional’s (SMN) first forecast for the season, predicting a total of 18 named storms, ten hurricanes, and seven major hurricanes to develop.
For 14th consecutive year, WebSitePulse will provide free monitoring and notifications during 2019 hurricane season to five of the most popular websites that present their users with real-time forecasts, emergency information and donation opportunities in times of hurricanes, floods, and other natural or man-caused disasters.
The WebSitePulse Performance Reports will measure the websites’ uptime and response time as the most important metrics for the availability and the reliability of any web-based operation, critical for the End Users' overall online experience. Measurements of web transactions will be made every 15 minutes, simultaneously from 3 different monitoring locations. In-depth analytical information is also collected and stored in the WebSitePulse system for future references.
The Reports reflect the most common performance criteria: response time and availability - but in-debt analytical information is also collected and stored in the WebSitePulse system for future references.
According to Colorado State University’s (CSU) Tropical Meteorology Project, as from August the 5th 14 named storms, seven hurricanes, two major hurricanes and an ACE of 105 are expected until the end of this year’s Atlantic Hurricane Season.
For 14th consecutive year, WebSitePulse will provide free monitoring and notifications during 2019 hurricane season to five of the most popular websites that present their users with real-time forecasts, emergency information and donation opportunities in times of hurricanes, floods, and other natural or man-caused disasters.
The WebSitePulse Performance Reports will measure the websites’ uptime and response time as the most important metrics for the availability and the reliability of any web-based operation, critical for the End Users' overall online experience. Measurements of web transactions will be made every 15 minutes, simultaneously from 3 different monitoring locations. In-depth analytical information is also collected and stored in the WebSitePulse system for future references.
The Reports reflect the most common performance criteria: response time and availability - but in-debt analytical information is also collected and stored in the WebSitePulse system for future references.
| Daily Report for October 31, 2019 | See report for: |
WebSitePulse reports the following results from web performance measurement of the Hurricane- and disaster-related websites:
The daily Average Response time from all monitored websites was 0.745 sec.
| The Average Response time as measured from the US East Coast (Trumbull, CT) was: | 0.736 sec. |
| The Average Response time as measured from the US West Coast (San Francisco, CA) was: | 0.861 sec. |
| The Average Response time as measured from the US Central was (Chicago, IL): | 0.638 sec. |
| The Best Response time measured from US East Coast (Trumbull, CT): | 0.223 sec. |
| The Best Response time measured from US West Coast (San Francisco, CA): | 0.212 sec. |
| The Best Response time measured from US Central was (Chicago, IL): | 0.214 sec. |
The typical shopping transaction took the least time for nhc.noaa.gov visitors - 0.216 sec., while the visitors of weather.com had to be the most patient, as the shopping transaction there took in average of 1.666 sec.
Two of the monitored websites delivered above-the-average response times for their transactions, while three of them demonstrated below-the-average daily performance.
The daily Average Uptime for the entire Group was 100%.
All websites were available with no interruptions.
Report Highlights
No events of particular importance or possible negative impact on the online visitors' interaction with the Websites included into the 2019 Hurricane Season report were detected during the reported period, and according to WebSitePulse, the Group delivered the expected levels of End-User experience and Customer satisfaction.
Please, scroll down for Detailed Reports and Charts provided by WebSitePulse:
Daily Response Times
| Legend: | ||||
| nhc.noaa.gov | weather | redcross.org | floridadisaster.org | salvationarmy.org |
Average Response Times for October 31, 2019
| # | Target | Trumbull | San Francisco | Chicago | Avg. resp. time |
|---|---|---|---|---|---|
| 1 | nhc.noaa.gov | 0.223 | 0.212 | 0.214 | 0.216 |
| 2 | redcross.org | 0.428 | 0.402 | 0.448 | 0.426 |
| 3 | salvationarmy.org | 0.874 | 0.827 | 0.257 | 0.653 |
| 4 | floridadisaster.org | 0.676 | 0.952 | 0.664 | 0.764 |
| 5 | weather.com | 1.477 | 1.911 | 1.609 | 1.666 |
Average Response Times August 19, 2019 - October 31, 2019
| # | Target | Trumbull | San Francisco | Chicago | Avg. resp. time |
|---|---|---|---|---|---|
| 1 | nhc.noaa.gov | 0.302 | 0.236 | 0.223 | 0.254 |
| 2 | redcross.org | 0.466 | 0.387 | 0.406 | 0.420 |
| 3 | salvationarmy.org | 0.443 | 0.824 | 0.290 | 0.519 |
| 4 | floridadisaster.org | 0.998 | 1.203 | 0.817 | 1.006 |
| 5 | weather.com | 1.275 | 1.194 | 1.192 | 1.220 |
Hourly Average Response Times
Select individual website to display:
| Legend: | |
| individual site response times | monitored group average response times |
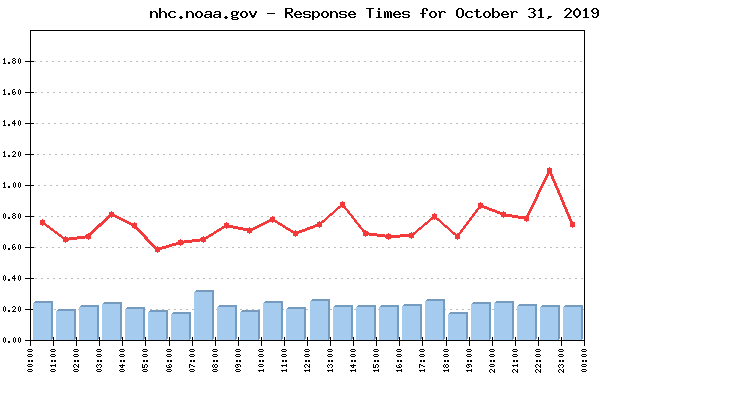
Average response times by hour for October 31, 2019
| Target | Hours | |||||||||||||||||||||||
| 00 | 01 | 02 | 03 | 04 | 05 | 06 | 07 | 08 | 09 | 10 | 11 | 12 | 13 | 14 | 15 | 16 | 17 | 18 | 19 | 20 | 21 | 22 | 23 | |
| floridadisaster.org | 0.73 | 0.96 | 0.71 | 0.75 | 0.94 | 0.75 | 0.74 | 0.75 | 0.69 | 0.71 | 1.02 | 0.74 | 0.75 | 0.82 | 0.73 | 0.70 | 0.75 | 0.73 | 0.74 | 0.72 | 0.73 | 0.72 | 0.72 | 0.74 |
| nhc.noaa.gov | 0.24 | 0.19 | 0.21 | 0.23 | 0.20 | 0.18 | 0.17 | 0.31 | 0.21 | 0.18 | 0.24 | 0.20 | 0.25 | 0.21 | 0.21 | 0.21 | 0.22 | 0.25 | 0.17 | 0.23 | 0.24 | 0.22 | 0.21 | 0.21 |
| redcross.org | 0.39 | 0.39 | 0.37 | 0.44 | 0.36 | 0.40 | 0.39 | 0.47 | 0.46 | 0.41 | 0.38 | 0.42 | 0.46 | 0.46 | 0.43 | 0.44 | 0.40 | 0.39 | 0.40 | 0.41 | 0.60 | 0.52 | 0.47 | 0.38 |
| salvationarmy.org | 0.47 | 0.43 | 0.86 | 0.86 | 0.90 | 0.44 | 0.49 | 0.44 | 0.49 | 0.86 | 0.84 | 0.44 | 0.47 | 0.86 | 0.50 | 0.46 | 0.53 | 0.86 | 0.86 | 0.91 | 0.94 | 0.45 | 0.85 | 0.45 |
| weather | 2.00 | 1.26 | 1.22 | 1.76 | 1.30 | 1.17 | 1.37 | 1.28 | 1.84 | 1.38 | 1.45 | 1.63 | 1.80 | 2.07 | 1.60 | 1.55 | 1.49 | 1.76 | 1.20 | 2.08 | 1.51 | 2.06 | 3.22 | 1.97 |
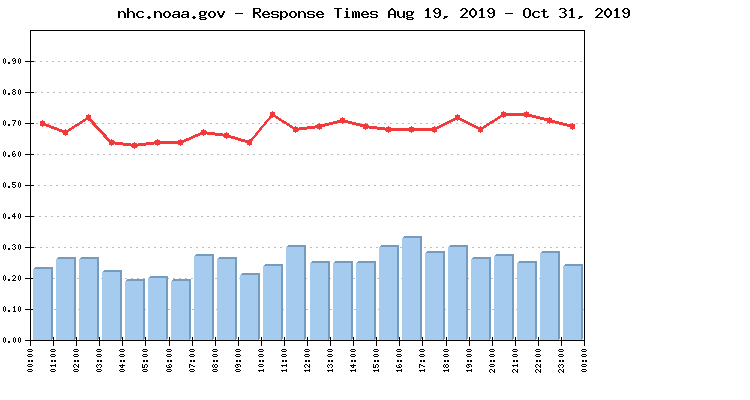
Average response times by hour August 19, 2019 - October 31, 2019
| Target | Hours | |||||||||||||||||||||||
| 00 | 01 | 02 | 03 | 04 | 05 | 06 | 07 | 08 | 09 | 10 | 11 | 12 | 13 | 14 | 15 | 16 | 17 | 18 | 19 | 20 | 21 | 22 | 23 | |
| floridadisaster.org | 1.16 | 1.05 | 1.29 | 0.94 | 0.94 | 0.89 | 0.94 | 0.90 | 0.98 | 0.93 | 1.23 | 0.95 | 1.13 | 1.07 | 1.05 | 0.91 | 0.87 | 0.99 | 1.05 | 0.90 | 0.95 | 0.97 | 0.98 | 1.07 |
| nhc.noaa.gov | 0.23 | 0.26 | 0.26 | 0.22 | 0.19 | 0.20 | 0.19 | 0.27 | 0.26 | 0.21 | 0.24 | 0.30 | 0.25 | 0.25 | 0.25 | 0.30 | 0.33 | 0.28 | 0.30 | 0.26 | 0.27 | 0.25 | 0.28 | 0.24 |
| redcross.org | 0.39 | 0.38 | 0.38 | 0.39 | 0.40 | 0.44 | 0.40 | 0.46 | 0.41 | 0.42 | 0.41 | 0.41 | 0.41 | 0.43 | 0.41 | 0.40 | 0.42 | 0.41 | 0.42 | 0.46 | 0.51 | 0.43 | 0.48 | 0.40 |
| salvationarmy.org | 0.52 | 0.50 | 0.56 | 0.50 | 0.51 | 0.54 | 0.51 | 0.53 | 0.51 | 0.50 | 0.50 | 0.52 | 0.50 | 0.54 | 0.54 | 0.55 | 0.52 | 0.49 | 0.49 | 0.51 | 0.54 | 0.55 | 0.48 | 0.53 |
| weather | 1.17 | 1.17 | 1.13 | 1.15 | 1.11 | 1.15 | 1.17 | 1.20 | 1.13 | 1.15 | 1.25 | 1.20 | 1.17 | 1.23 | 1.22 | 1.22 | 1.29 | 1.22 | 1.32 | 1.27 | 1.37 | 1.45 | 1.33 | 1.22 |
Uptime
Uptime October 31, 2019
| # | Target | Trumbull | San Francisco | Chicago | Avg. uptime |
|---|---|---|---|---|---|
| 1 | salvationarmy.org | 100.000% | 100.000% | 100.000% | 100.000% |
| 2 | floridadisaster.org | 100.000% | 100.000% | 100.000% | 100.000% |
| 3 | redcross.org | 100.000% | 100.000% | 100.000% | 100.000% |
| 4 | weather.com | 100.000% | 100.000% | 100.000% | 100.000% |
| 5 | nhc.noaa.gov | 100.000% | 100.000% | 100.000% | 100.000% |
Uptime August 19, 2019 - October 31, 2019
| # | Target | Trumbull | San Francisco | Chicago | Avg. uptime |
|---|---|---|---|---|---|
| 1 | redcross.org | 99.996% | 99.997% | 100.000% | 99.998% |
| 2 | salvationarmy.org | 99.997% | 99.994% | 100.000% | 99.997% |
| 3 | nhc.noaa.gov | 100.000% | 100.000% | 99.990% | 99.997% |
| 4 | weather.com | 99.921% | 99.916% | 99.913% | 99.917% |
| 5 | floridadisaster.org | 99.784% | 99.773% | 99.760% | 99.772% |
Methodology:
WebSitePulse Performance Reports measure Uptime and Response Time as the most important metrics for the availability and the reliability of any web-based operation. Performance measurement takes place daily, every 15 minutes during the entire Hurricane season. The WebSitePulse website monitoring service is used to collect data and to create the reports.
The simultaneous monitoring is performed from 3 US locations of the WebSitePulse monitoring network: Trumbull, CT, San Francisco, CA and Chicago, IL. In case of a detected malfunction or unavailability, the system performs automated error verification from 3 independent resources and only after the above procedure is performed and has returned consistent results, the detected error is confirmed, recorded, and included in the daily performance reports. In these cases, an advanced WebSitePulse exclusive feature comes into play - Forced Monitoring - which automatically switches to a 3 minute - monitoring interval for increased accuracy.
About WebSitePulse:
WebSitePulse is a leading provider of global, independent, and objective availability and performance monitoring of web sites, servers, network components, web applications, e-business- and email round-trip transactions.
Contact:
For more information about this report please contact:
George T., CTO
phone: 1-407-380-1600
email:
Reproduction:
WebSitePulse launched the Performance and Uptime Reports program to keep the general public and the Internet community informed about the performance of specific websites and the challenges their webmasters, owners and operators are facing on a daily basis, especially when the web traffic intensifies due to some special events through the year. Some of the most popular web destinations, related to each particular event, are selected for the purpose of the Reports, and data from their performance measurements is made available on the WebSitePulse public website.
With the intention to broadly disseminate this information for the benefit of the Internet community, we encourage the use of this information without prior approval and under the following Terms and Conditions:
- WebSitePulse should be referred as the "Source" of the information;
- WebSitePulse should be acknowledged as the owner of the copyrights of the information in the Reports;
- The texts of the Reports could be changed or altered to better suit the needs and the style of the publisher without prior notice to WebSitePulse. However, the integrity and the meaning of the information should be preserved;
The Data from the performance measurements cannot be changed or manipulated and should be used "as is".