
Performance Tracking > 2020 Vacation Planning > Daily Reports
The WebSitePulse Performance Reports measure Website Uptime and Website Response Time as the most important metrics for the availability and the reliability of any web-based operation, critical for the End Users' overall online experience. The Reports reflect not only the performance of the websites home pages, but typically measure a complete web transaction representative for the End Users' interactions with a website. Measurements of the multi-step web transactions are made every 15 minutes, simultaneously from 4 different monitoring locations. The WebSitePulse advanced monitoring system has automated, built-in false alarm prevention and error verification controls that ensure the reliability of the measurement results. The Reports reflect the most common website performance criteria - response time and availability. In-depth analytical information is also collected and stored in the WebSitePulse system for future references. The WebSitePulse Application Monitoring service is used to collect data and produce the Report.
WebSitePulse reports the following results from web performance measurement of the leading international summer vacation planning and booking websites:
The daily Average Response time from all monitored websites was 4.738 sec.
The typical shopping transaction took the least time for hostelworld.com visitors - 2.606 sec., while the visitors of edreams.com had to be the most patient, as the shopping transaction there took in average of 8.317 sec.
Four of the monitored websites delivered above-the-average response times for their transactions, while six of them demonstrated below-the-average daily performance.
The daily average uptime for the entire Group was 99.62%.
Seven websites were available with no interruptions - 100%.
Seven websites' availability was above the average, while three sites dragged the average down with below-the-average availability.
Report Highlights
No events of particular importance or possible negative impact on the online visitors' interaction with the Websites included into the 2020 Vacation Planning report were detected during the reported period, and according to WebSitePulse, the Group delivered the expected levels of End-User experience and Customer satisfaction.
Please, scroll down for Detailed Reports and Charts provided by WebSitePulse:
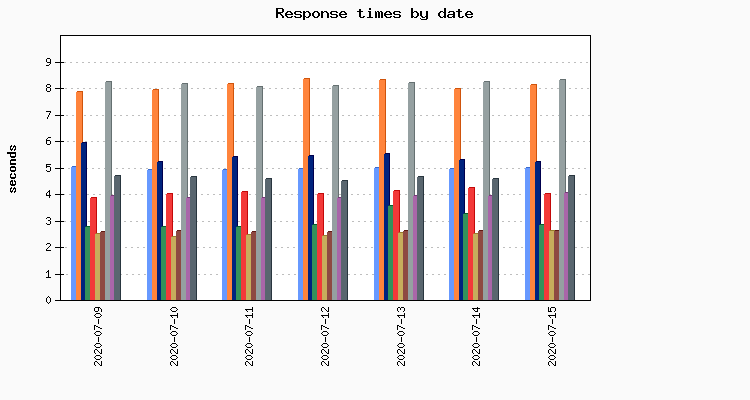
Daily Response Times
Average Response Times for July 15, 2020
Average Response Times June 10, 2020 - July 15, 2020
Hourly Average Response Times
Select individual website to display:
Average response times by hour for July 15, 2020
Average response times by hour June 10, 2020 - July 15, 2020
Uptime
Uptime July 15, 2020
Uptime June 10, 2020 - July 15, 2020
Methodology:
Performance and availability are measured for a typical travel-related booking web transaction at 15 minute monitoring interval, every day, 24/7. The WebSitePulse application monitoring service is used to collect data and to create the reports.
The steps in each transaction are comparable for all websites, and reflect the real online buyers' experience. The simultaneous monitoring is performed from four locations of the WebSitePulse global monitoring network: San Francisco, CA; Washington, DC; Sydney, Australia, and Amsterdam, Netherlands. In case of a detected malfunction or unavailability, the system performs automated error verification from four independent resources and only after the above procedure is performed and has returned consistent results, the detected error is confirmed, recorded, and included in the daily performance reports. In these cases, an advanced WebSitePulse exclusive feature comes into play - Forced Monitoring -, which automatically switches to a 3 minute monitoring interval for increased accuracy.
About WebSitePulse:
WebSitePulse is a leading provider of global, independent, and objective availability and performance monitoring of web sites, servers, network components, web applications, e-business- and email round-trip transactions.
Contact:
For more information about this report please contact:
George T., CTO
phone: 1-407-380-1600
email:
Reproduction:
WebSitePulse launched the Performance and Uptime Reports program to keep the general public and the Internet community informed about the performance of specific websites and the challenges their webmasters, owners and operators are facing on a daily basis, especially when the web traffic intensifies due to some special events through the year. Some of the most popular web destinations, related to each particular event, are selected for the purpose of the Reports, and data from their performance measurements is made available on the WebSitePulse public website.
With the intention to broadly disseminate this information for the benefit of the Internet community, we encourage the use of this information without prior approval and under the following Terms and Conditions:
The Data from the performance measurements cannot be changed or manipulated and should be used "as is".
WebSitePulse 2020 Vacation Planning Websites Performance & Uptime Report
The WebSitePulse Performance Reports measure Website Uptime and Website Response Time as the most important metrics for the availability and the reliability of any web-based operation, critical for the End Users' overall online experience. The Reports reflect not only the performance of the websites home pages, but typically measure a complete web transaction representative for the End Users' interactions with a website. Measurements of the multi-step web transactions are made every 15 minutes, simultaneously from 4 different monitoring locations. The WebSitePulse advanced monitoring system has automated, built-in false alarm prevention and error verification controls that ensure the reliability of the measurement results. The Reports reflect the most common website performance criteria - response time and availability. In-depth analytical information is also collected and stored in the WebSitePulse system for future references. The WebSitePulse Application Monitoring service is used to collect data and produce the Report.
| Daily Report for July 15, 2020 | See report for: |
WebSitePulse reports the following results from web performance measurement of the leading international summer vacation planning and booking websites:
The daily Average Response time from all monitored websites was 4.738 sec.
| The Average Response time as measured from the US East Coast (Washington, DC) was: | 2.811 sec. |
| The Average Response time as measured from the US West Coast (San Francisco, CA) was: | 4.100 sec. |
| The Average Response time as measured from the Australia (Sydney) was: | 7.930 sec. |
| The Average Response time as measured from the Europe (Amsterdam) was: | 4.111 sec. |
| The Best Response time measured from US East Coast (Washington, DC): | 0.847 sec. |
| The Best Response time measured from US West Coast (San Francisco, CA): | 1.756 sec. |
| The Best Response time measured from Australia (Sydney): | 3.609 sec. |
| The Best Response time measured from Europe (Amsterdam): | 2.057 sec. |
The typical shopping transaction took the least time for hostelworld.com visitors - 2.606 sec., while the visitors of edreams.com had to be the most patient, as the shopping transaction there took in average of 8.317 sec.
Four of the monitored websites delivered above-the-average response times for their transactions, while six of them demonstrated below-the-average daily performance.
The daily average uptime for the entire Group was 99.62%.
| The Average Uptime as measured from the US East Coast (Washington, DC) was: | 99.63% |
| The Average Uptime as measured from the US West Coast (San Francisco, CA) was: | 99.60% |
| The Average Uptime as measured from the Australia (Sydney): | 99.61% |
| The Average Uptime as measured from the Europe (Amsterdam): | 99.64% |
Seven websites were available with no interruptions - 100%.
Seven websites' availability was above the average, while three sites dragged the average down with below-the-average availability.
Report Highlights
No events of particular importance or possible negative impact on the online visitors' interaction with the Websites included into the 2020 Vacation Planning report were detected during the reported period, and according to WebSitePulse, the Group delivered the expected levels of End-User experience and Customer satisfaction.
Please, scroll down for Detailed Reports and Charts provided by WebSitePulse:
Daily Response Times
| Legend: | ||||
| booking | hotels | tripadvisor | airbnb | homeaway |
| hostelworld | vrbo | edreams | flipkey | hotelplanner |
Average Response Times for July 15, 2020
| # | Target | San Francisco | Amsterdam | Washington | Sydney | Avg. resp. time |
|---|---|---|---|---|---|---|
| 1 | hostelworld.com | 2.423 | 2.057 | 2.336 | 3.609 | 2.606 |
| 2 | vrbo.com | 1.756 | 2.224 | 0.910 | 5.570 | 2.615 |
| 3 | airbnb.com | 2.559 | 2.314 | 0.847 | 5.548 | 2.817 |
| 4 | homeaway.com | 2.397 | 3.897 | 1.402 | 8.363 | 4.015 |
| 5 | flipkey.com | 3.155 | 4.050 | 1.161 | 7.813 | 4.045 |
| 6 | hotelplanner.com | 2.173 | 5.645 | 1.957 | 8.915 | 4.673 |
| 7 | booking.com | 5.765 | 3.441 | 3.497 | 7.219 | 4.981 |
| 8 | tripadvisor.com | 4.966 | 5.230 | 4.229 | 6.411 | 5.209 |
| 9 | hotels.com | 6.509 | 8.537 | 6.714 | 10.651 | 8.103 |
| 10 | edreams.com | 9.294 | 3.714 | 5.059 | 15.201 | 8.317 |
Average Response Times June 10, 2020 - July 15, 2020
| # | Target | San Francisco | Amsterdam | Washington | Sydney | Avg. resp. time |
|---|---|---|---|---|---|---|
| 1 | hostelworld.com | 2.533 | 2.363 | 2.048 | 3.579 | 2.631 |
| 2 | vrbo.com | 1.796 | 2.077 | 0.872 | 5.780 | 2.631 |
| 3 | airbnb.com | 2.407 | 2.412 | 0.989 | 7.341 | 3.287 |
| 4 | homeaway.com | 2.137 | 2.871 | 1.137 | 7.317 | 3.365 |
| 5 | flipkey.com | 3.257 | 3.825 | 1.271 | 7.526 | 3.970 |
| 6 | hotelplanner.com | 2.334 | 5.878 | 2.128 | 9.076 | 4.854 |
| 7 | booking.com | 5.764 | 3.503 | 3.566 | 7.317 | 5.038 |
| 8 | tripadvisor.com | 5.503 | 5.298 | 4.489 | 6.355 | 5.411 |
| 9 | hotels.com | 6.779 | 8.352 | 6.666 | 11.264 | 8.265 |
| 10 | edreams.com | 9.114 | 3.734 | 5.080 | 15.315 | 8.310 |
Hourly Average Response Times
Select individual website to display:
| Legend: | |
| individual site response times | monitored group average response times |
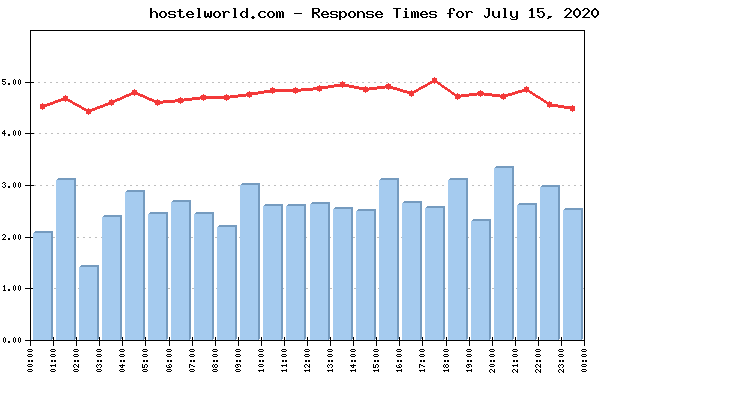
Average response times by hour for July 15, 2020
| Target | Hours | |||||||||||||||||||||||
| 00 | 01 | 02 | 03 | 04 | 05 | 06 | 07 | 08 | 09 | 10 | 11 | 12 | 13 | 14 | 15 | 16 | 17 | 18 | 19 | 20 | 21 | 22 | 23 | |
| airbnb | 2.80 | 2.82 | 2.68 | 2.87 | 2.84 | 3.00 | 2.68 | 2.77 | 2.89 | 2.78 | 2.81 | 2.86 | 3.01 | 2.89 | 3.01 | 2.71 | 2.92 | 2.97 | 2.89 | 2.76 | 2.82 | 2.71 | 2.57 | 2.54 |
| booking | 4.78 | 4.89 | 4.86 | 4.91 | 4.89 | 4.97 | 4.93 | 4.94 | 5.11 | 5.14 | 4.99 | 5.13 | 5.13 | 5.30 | 5.11 | 5.21 | 5.07 | 4.99 | 4.97 | 4.85 | 4.95 | 4.78 | 4.88 | 4.78 |
| edreams | 8.05 | 8.13 | 8.23 | 8.22 | 8.24 | 8.28 | 8.30 | 8.48 | 8.57 | 8.56 | 8.72 | 8.56 | 8.52 | 8.61 | 8.38 | 8.51 | 8.48 | 8.15 | 8.15 | 8.06 | 8.23 | 8.14 | 8.11 | 7.91 |
| flipkey | 3.97 | 3.87 | 3.84 | 3.95 | 3.91 | 3.99 | 3.93 | 3.85 | 4.04 | 3.95 | 3.96 | 4.00 | 4.12 | 3.97 | 4.07 | 3.93 | 3.90 | 6.41 | 3.95 | 3.85 | 3.85 | 3.92 | 3.94 | 3.92 |
| homeaway | 4.23 | 4.18 | 3.99 | 4.05 | 4.08 | 3.67 | 3.85 | 4.18 | 4.06 | 4.02 | 3.99 | 3.79 | 4.05 | 4.15 | 4.31 | 4.01 | 4.03 | 4.04 | 3.92 | 4.01 | 3.95 | 3.79 | 3.92 | 4.09 |
| hostelworld | 2.08 | 3.09 | 1.41 | 2.39 | 2.87 | 2.44 | 2.67 | 2.43 | 2.18 | 3.00 | 2.60 | 2.60 | 2.63 | 2.54 | 2.49 | 3.10 | 2.66 | 2.55 | 3.10 | 2.30 | 3.33 | 2.62 | 2.96 | 2.51 |
| hotelplanner | 4.27 | 4.58 | 4.67 | 4.54 | 5.14 | 4.41 | 4.34 | 4.38 | 4.22 | 4.40 | 4.41 | 4.82 | 5.19 | 5.10 | 4.92 | 4.98 | 4.69 | 4.77 | 4.86 | 4.90 | 4.40 | 5.03 | 4.60 | 4.53 |
| hotels | 7.68 | 8.21 | 7.80 | 7.69 | 8.09 | 7.92 | 8.71 | 8.03 | 7.58 | 7.42 | 8.54 | 8.06 | 7.26 | 8.95 | 8.25 | 8.85 | 8.40 | 7.86 | 8.09 | 8.14 | 8.56 | 9.72 | 7.66 | 6.99 |
| tripadvisor | 4.79 | 4.65 | 4.40 | 4.86 | 5.31 | 4.91 | 4.47 | 5.43 | 5.92 | 5.89 | 5.45 | 5.35 | 6.27 | 5.49 | 5.16 | 5.11 | 5.08 | 5.84 | 5.00 | 6.31 | 4.64 | 5.30 | 4.28 | 5.13 |
| vrbo | 2.64 | 2.44 | 2.39 | 2.66 | 2.59 | 2.40 | 2.48 | 2.56 | 2.49 | 2.59 | 2.82 | 3.23 | 2.54 | 2.55 | 2.85 | 2.75 | 2.58 | 2.73 | 2.39 | 2.59 | 2.55 | 2.63 | 2.69 | 2.62 |
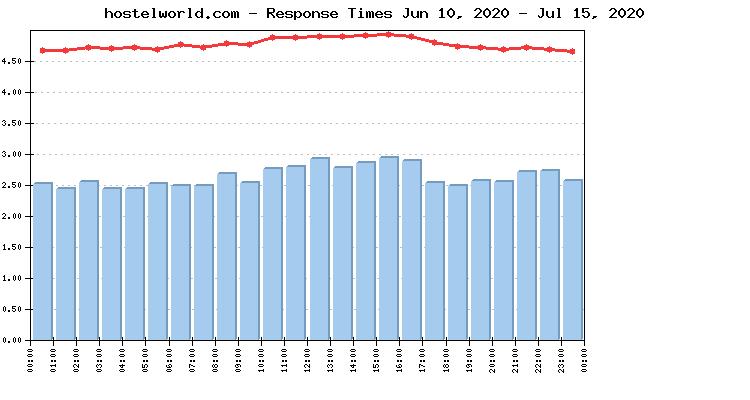
Average response times by hour June 10, 2020 - July 15, 2020
| Target | Hours | |||||||||||||||||||||||
| 00 | 01 | 02 | 03 | 04 | 05 | 06 | 07 | 08 | 09 | 10 | 11 | 12 | 13 | 14 | 15 | 16 | 17 | 18 | 19 | 20 | 21 | 22 | 23 | |
| airbnb | 3.15 | 3.11 | 3.30 | 3.21 | 3.31 | 3.15 | 3.25 | 3.16 | 3.42 | 3.21 | 3.33 | 3.49 | 3.41 | 3.43 | 3.33 | 3.38 | 3.50 | 3.36 | 3.38 | 3.14 | 3.04 | 3.39 | 3.19 | 3.24 |
| booking | 4.92 | 4.92 | 4.93 | 5.00 | 5.00 | 5.06 | 5.02 | 5.05 | 5.10 | 5.12 | 5.00 | 5.17 | 5.15 | 5.14 | 5.14 | 5.22 | 5.18 | 5.06 | 5.01 | 4.95 | 4.96 | 4.95 | 4.93 | 4.91 |
| edreams | 8.19 | 8.33 | 8.30 | 8.30 | 8.28 | 8.32 | 8.36 | 8.37 | 8.39 | 8.39 | 8.26 | 8.38 | 8.37 | 8.42 | 8.46 | 8.44 | 8.39 | 8.30 | 8.24 | 8.21 | 8.20 | 8.19 | 8.20 | 8.13 |
| flipkey | 4.09 | 3.99 | 3.95 | 3.98 | 4.01 | 3.97 | 3.96 | 3.92 | 3.93 | 3.96 | 4.04 | 4.01 | 3.95 | 3.96 | 4.01 | 3.99 | 3.86 | 4.02 | 3.93 | 3.93 | 3.96 | 3.97 | 3.93 | 3.94 |
| homeaway | 3.29 | 3.21 | 3.24 | 3.26 | 3.29 | 3.27 | 3.27 | 3.29 | 3.35 | 3.43 | 3.46 | 3.47 | 3.48 | 3.46 | 3.50 | 3.51 | 3.45 | 3.36 | 3.36 | 3.37 | 3.40 | 3.36 | 3.38 | 3.34 |
| hostelworld | 2.52 | 2.44 | 2.55 | 2.43 | 2.43 | 2.52 | 2.48 | 2.48 | 2.68 | 2.53 | 2.76 | 2.79 | 2.92 | 2.78 | 2.86 | 2.94 | 2.89 | 2.54 | 2.48 | 2.57 | 2.55 | 2.71 | 2.72 | 2.56 |
| hotelplanner | 4.67 | 4.78 | 4.79 | 4.95 | 4.76 | 4.56 | 4.61 | 4.61 | 4.56 | 4.71 | 4.99 | 5.00 | 5.06 | 5.17 | 5.19 | 5.00 | 4.98 | 4.93 | 4.99 | 4.87 | 5.00 | 4.82 | 4.77 | 4.71 |
| hotels | 8.21 | 8.12 | 8.20 | 8.13 | 8.22 | 7.88 | 8.38 | 8.13 | 8.20 | 8.13 | 8.35 | 8.31 | 8.45 | 8.44 | 8.46 | 8.59 | 8.53 | 8.46 | 8.40 | 8.33 | 8.19 | 8.06 | 8.08 | 8.12 |
| tripadvisor | 5.20 | 5.24 | 5.41 | 5.36 | 5.43 | 5.57 | 5.75 | 5.53 | 5.63 | 5.58 | 5.81 | 5.52 | 5.55 | 5.50 | 5.52 | 5.55 | 5.51 | 5.38 | 5.14 | 5.27 | 5.09 | 5.18 | 5.06 | 5.11 |
| vrbo | 2.58 | 2.51 | 2.52 | 2.50 | 2.55 | 2.55 | 2.59 | 2.64 | 2.64 | 2.69 | 2.79 | 2.73 | 2.75 | 2.71 | 2.75 | 2.70 | 2.72 | 2.61 | 2.55 | 2.59 | 2.64 | 2.64 | 2.63 | 2.56 |
Uptime
Uptime July 15, 2020
| # | Target | San Francisco | Amsterdam | Washington | Sydney | Avg. uptime |
|---|---|---|---|---|---|---|
| 1 | hotelplanner.com | 100.000% | 100.000% | 100.000% | 100.000% | 100.000% |
| 2 | vrbo.com | 100.000% | 100.000% | 100.000% | 100.000% | 100.000% |
| 3 | edreams.com | 100.000% | 100.000% | 100.000% | 100.000% | 100.000% |
| 4 | booking.com | 100.000% | 100.000% | 100.000% | 100.000% | 100.000% |
| 5 | airbnb.com | 100.000% | 100.000% | 100.000% | 100.000% | 100.000% |
| 6 | flipkey.com | 100.000% | 100.000% | 100.000% | 100.000% | 100.000% |
| 7 | tripadvisor.com | 100.000% | 100.000% | 100.000% | 100.000% | 100.000% |
| 8 | hotels.com | 99.000% | 99.500% | 99.440% | 99.290% | 99.308% |
| 9 | homeaway.com | 99.270% | 98.780% | 98.870% | 98.760% | 98.920% |
| 10 | hostelworld.com | 97.730% | 98.150% | 98.030% | 98.030% | 97.985% |
Uptime June 10, 2020 - July 15, 2020
| # | Target | San Francisco | Amsterdam | Washington | Sydney | Avg. uptime |
|---|---|---|---|---|---|---|
| 1 | tripadvisor.com | 100.000% | 100.000% | 100.000% | 99.980% | 99.995% |
| 2 | hotelplanner.com | 99.988% | 99.994% | 100.000% | 99.993% | 99.994% |
| 3 | vrbo.com | 99.979% | 99.985% | 99.983% | 99.985% | 99.983% |
| 4 | airbnb.com | 99.961% | 99.959% | 99.971% | 99.989% | 99.970% |
| 5 | edreams.com | 99.967% | 99.950% | 99.963% | 99.977% | 99.964% |
| 6 | booking.com | 99.963% | 99.955% | 99.964% | 99.953% | 99.958% |
| 7 | flipkey.com | 99.971% | 99.934% | 99.966% | 99.925% | 99.949% |
| 8 | hostelworld.com | 99.926% | 99.943% | 99.945% | 99.945% | 99.940% |
| 9 | homeaway.com | 99.831% | 99.810% | 99.783% | 99.802% | 99.807% |
| 10 | hotels.com | 99.638% | 99.601% | 99.626% | 99.566% | 99.608% |
Methodology:
Performance and availability are measured for a typical travel-related booking web transaction at 15 minute monitoring interval, every day, 24/7. The WebSitePulse application monitoring service is used to collect data and to create the reports.
The steps in each transaction are comparable for all websites, and reflect the real online buyers' experience. The simultaneous monitoring is performed from four locations of the WebSitePulse global monitoring network: San Francisco, CA; Washington, DC; Sydney, Australia, and Amsterdam, Netherlands. In case of a detected malfunction or unavailability, the system performs automated error verification from four independent resources and only after the above procedure is performed and has returned consistent results, the detected error is confirmed, recorded, and included in the daily performance reports. In these cases, an advanced WebSitePulse exclusive feature comes into play - Forced Monitoring -, which automatically switches to a 3 minute monitoring interval for increased accuracy.
About WebSitePulse:
WebSitePulse is a leading provider of global, independent, and objective availability and performance monitoring of web sites, servers, network components, web applications, e-business- and email round-trip transactions.
Contact:
For more information about this report please contact:
George T., CTO
phone: 1-407-380-1600
email:
Reproduction:
WebSitePulse launched the Performance and Uptime Reports program to keep the general public and the Internet community informed about the performance of specific websites and the challenges their webmasters, owners and operators are facing on a daily basis, especially when the web traffic intensifies due to some special events through the year. Some of the most popular web destinations, related to each particular event, are selected for the purpose of the Reports, and data from their performance measurements is made available on the WebSitePulse public website.
With the intention to broadly disseminate this information for the benefit of the Internet community, we encourage the use of this information without prior approval and under the following Terms and Conditions:
- WebSitePulse should be referred as the "Source" of the information;
- WebSitePulse should be acknowledged as the owner of the copyrights of the information in the Reports;
- The texts of the Reports could be changed or altered to better suit the needs and the style of the publisher without prior notice to WebSitePulse. However, the integrity and the meaning of the information should be preserved;
The Data from the performance measurements cannot be changed or manipulated and should be used "as is".