
Performance Tracking > 2018 Tax Websites
WebSitePulse is monitoring twelve of the most popular tax websites for the 2018 Tax season. The measurement results indicate the performance levels and the availability of the websites related to the increased Internet traffic and online e-filing services during the selected period.
Continuous web monitoring for all twelve websites covers the period between April 05 and April 18, 2018. The reports and the charts are updated daily, displaying the results from the previous day and for the entire monitoring period to the current date. You can read more about the methodology we use to prepare this report.
WebSitePulse reports the following results from web performance measurement of the leading US Tax Websites:
The daily Average Response time from all monitored websites was 12.434 sec.
The typical shopping transaction took the least time for fileonline.1040.com visitors - 2.169 sec., while the visitors of efile.com had to be the most patient, as the shopping transaction there took in average of 38.810 sec.
Five of the monitored websites delivered above-the-average response times for their transactions, while seven of them demonstrated below-the-average daily performance.
The daily average uptime for the entire Group was 99.2%.
Eight websites were available with no interruptions - 100%.
Nine websites' availability was above the average, while three sites dragged the average down with below-the-average availability.
Report Highlights
No events of particular importance or possible negative impact on the online visitors' interaction with the Websites included into the 2018 Tax Websites report were detected during the reported period, and according to WebSitePulse, the Group delivered the expected levels of End-User experience and Customer satisfaction.
Please, scroll down for Detailed Reports and Charts provided by WebSitePulse:
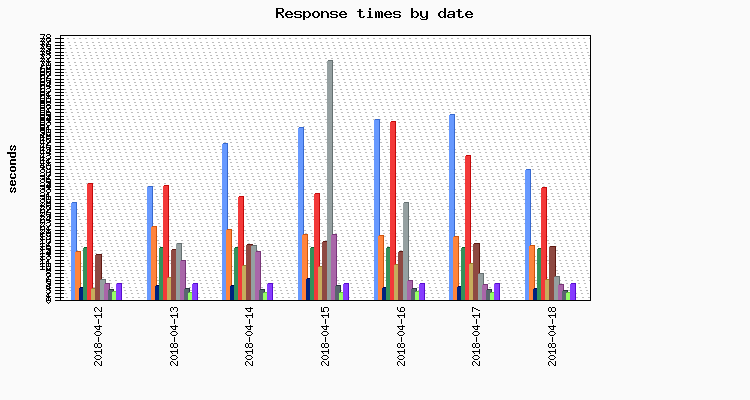
Daily Response Times
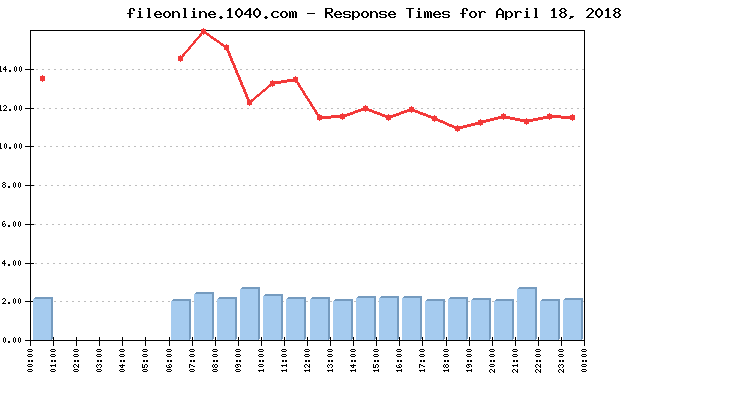
Average Response Times for April 18, 2018
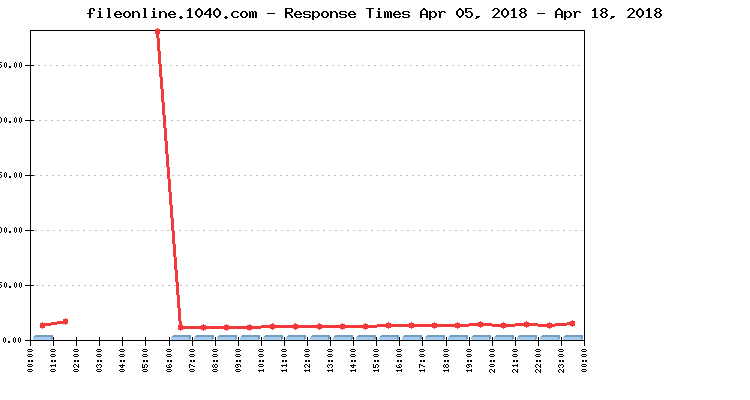
Average Response Times April 05, 2018 - April 18, 2018
Hourly Average Response Times
Select individual website to display:
Average response times by hour for April 18, 2018
Average response times by hour April 05, 2018 - April 18, 2018
Uptime
Uptime April 18, 2018
Uptime April 05, 2018 - April 18, 2018
Methodology:
The 2018 Tax Reports reflect a complete web transaction, representative for the End Users' interactions with a website. The reporting period covers the dates between April 05 and April 18, 2018. Performance and availability measurements are made for a typical multi-step web transaction at 15 minute monitoring interval, every day between the hours of 6AM and 3AM EST. Between 3AM and 6AM is the time when a scheduled maintenance most likely will be performed by IT staff and that is why we automatically suspend the monitoring process during this time every day. The WebSitePulse application monitoring service is used to collect data and to create the reports.
The steps in each transaction are comparable for all websites, and reflect the real online user and tax e-filer experience. The simultaneous monitoring is performed from 3 US-based locations of the WebSitePulse monitoring network: San Francisco, CA, Chicago, IL, and Washington, DC. In case of a detected malfunction or unavailability, the system performs automated error verification from 3 independent resources and only after the above procedure is performed and has returned consistent results, the detected error is confirmed, recorded, and included in the daily performance reports. In these cases, an advanced WebSitePulse exclusive feature comes into play - Forced Monitoring -, which automatically switches to a 3 minute monitoring interval for increased accuracy.
About WebSitePulse:
WebSitePulse is a leading provider of global, independent, and objective availability and performance monitoring of web sites, servers, network components, web applications, e-business- and email round-trip transactions.
Contact:
For more information about this report please contact:
George T., CTO
phone: 1-407-380-1600
email:
Reproduction:
WebSitePulse launched the Performance and Uptime Reports program to keep the general public and the Internet community informed about the performance of specific websites and the challenges their webmasters, owners and operators are facing on a daily basis, especially when the web traffic intensifies due to some special events through the year. Some of the most popular web destinations, related to each particular event, are selected for the purpose of the Reports, and data from their performance measurements is made available on the WebSitePulse public website.
With the intention to broadly disseminate this information for the benefit of the Internet community, we encourage the use of this information without prior approval and under the following Terms and Conditions:
The Data from the performance measurements cannot be changed or manipulated and should be used "as is".
WebSitePulse 2018 Tax Performance and Uptime Report
WebSitePulse is monitoring twelve of the most popular tax websites for the 2018 Tax season. The measurement results indicate the performance levels and the availability of the websites related to the increased Internet traffic and online e-filing services during the selected period.
Continuous web monitoring for all twelve websites covers the period between April 05 and April 18, 2018. The reports and the charts are updated daily, displaying the results from the previous day and for the entire monitoring period to the current date. You can read more about the methodology we use to prepare this report.
| Daily Report for April 18, 2018 | See report for: |
WebSitePulse reports the following results from web performance measurement of the leading US Tax Websites:
The daily Average Response time from all monitored websites was 12.434 sec.
| The Average Response time as measured from the US East Coast (Washington DC) was: | 8.978 sec. |
| The Average Response time as measured from the US West Coast (San Francisco, CA) was: | 17.802 sec. |
| The Average Response time as measured from the US Central was (Chicago, IL): | 10.523 sec. |
| The Best Response time measured from US East Coast (Washington DC): | 1.144 sec. |
| The Best Response time measured from US West Coast (San Francisco, CA): | 2.801 sec. |
| The Best Response time measured from US Central was (Chicago, IL): | 1.914 sec. |
The typical shopping transaction took the least time for fileonline.1040.com visitors - 2.169 sec., while the visitors of efile.com had to be the most patient, as the shopping transaction there took in average of 38.810 sec.
Five of the monitored websites delivered above-the-average response times for their transactions, while seven of them demonstrated below-the-average daily performance.
The daily average uptime for the entire Group was 99.2%.
| The Average Uptime as measured from the US East Coast (Washington DC) was: | 99.94% |
| The Average Uptime as measured from the US West Coast (San Francisco, CA) was: | 97.71% |
| The Average Uptime as measured from the US Central (Chicago, IL): | 99.94% |
Eight websites were available with no interruptions - 100%.
Nine websites' availability was above the average, while three sites dragged the average down with below-the-average availability.
Report Highlights
No events of particular importance or possible negative impact on the online visitors' interaction with the Websites included into the 2018 Tax Websites report were detected during the reported period, and according to WebSitePulse, the Group delivered the expected levels of End-User experience and Customer satisfaction.
Please, scroll down for Detailed Reports and Charts provided by WebSitePulse:
Daily Response Times
| Legend: | |||||
| efile | esmarttax | expresstaxrefund | hrblock | olt | |
| taxact | libertytax | turbotax | taxslayer | etax | fileonline.1040 |
| freetaxusa | |||||
Average Response Times for April 18, 2018
| # | Target | San Francisco | Chicago | Washington | Avg. resp. time |
|---|---|---|---|---|---|
| 1 | fileonline.1040.com | 3.448 | 1.914 | 1.144 | 2.169 |
| 2 | etax.com | 3.292 | 2.792 | 2.353 | 2.812 |
| 3 | expresstaxrefund.com | 3.482 | 3.399 | 2.758 | 3.213 |
| 4 | taxslayer.com | 6.788 | 3.812 | 2.753 | 4.451 |
| 5 | freetaxusa.com | 2.801 | 3.638 | 7.535 | 4.658 |
| 6 | taxact.com | 11.625 | 3.342 | 2.615 | 5.861 |
| 7 | turbotax.com | 6.733 | 9.127 | 4.272 | 6.711 |
| 8 | hrblock.com | 16.006 | 14.358 | 15.498 | 15.287 |
| 9 | libertytax.com | 29.845 | 11.155 | 6.152 | 15.717 |
| 10 | esmarttax.com | 31.299 | 10.908 | 5.908 | 16.038 |
| 11 | olt.com | 38.374 | 30.527 | 31.539 | 33.480 |
| 12 | efile.com | 59.927 | 31.299 | 25.205 | 38.810 |
Average Response Times April 05, 2018 - April 18, 2018
| # | Target | San Francisco | Chicago | Washington | Avg. resp. time |
|---|---|---|---|---|---|
| 1 | fileonline.1040.com | 3.761 | 2.111 | 1.319 | 2.397 |
| 2 | etax.com | 4.105 | 2.800 | 2.513 | 3.139 |
| 3 | expresstaxrefund.com | 4.849 | 3.473 | 2.955 | 3.759 |
| 4 | freetaxusa.com | 3.101 | 3.649 | 7.522 | 4.758 |
| 5 | taxact.com | 11.609 | 3.425 | 1.853 | 5.629 |
| 6 | taxslayer.com | 13.972 | 4.358 | 3.141 | 7.157 |
| 7 | libertytax.com | 26.458 | 10.287 | 7.377 | 14.708 |
| 8 | turbotax.com | 29.603 | 10.377 | 5.043 | 15.008 |
| 9 | hrblock.com | 16.159 | 14.456 | 15.714 | 15.443 |
| 10 | esmarttax.com | 32.590 | 11.314 | 6.145 | 16.683 |
| 11 | efile.com | 52.049 | 28.530 | 22.938 | 34.506 |
| 12 | olt.com | 41.983 | 32.892 | 35.246 | 36.707 |
Hourly Average Response Times
Select individual website to display:
| Legend: | |
| individual site response times | monitored group average response times |
Average response times by hour for April 18, 2018
| Target | Hours | |||||||||||||||||||||||
| 00 | 01 | 02 | 03 | 04 | 05 | 06 | 07 | 08 | 09 | 10 | 11 | 12 | 13 | 14 | 15 | 16 | 17 | 18 | 19 | 20 | 21 | 22 | 23 | |
| efile | 41.84 | - | - | - | - | - | 62.69 | 67.66 | 63.86 | 31.30 | 33.32 | 37.87 | 32.13 | 34.34 | 37.47 | 35.46 | 37.47 | 36.15 | 29.09 | 28.70 | 31.98 | 30.92 | 32.37 | 32.81 |
| esmarttax | 19.68 | - | - | - | - | - | 14.19 | 24.09 | 17.04 | 12.00 | 22.60 | 23.61 | 14.09 | 14.47 | 14.35 | 14.32 | 14.60 | 14.34 | 14.27 | 14.51 | 14.04 | 14.32 | 14.14 | 14.06 |
| etax | 2.66 | - | - | - | - | - | 2.44 | 2.51 | 3.05 | 2.58 | 2.66 | 2.62 | 2.92 | 2.55 | 3.05 | 2.71 | 2.89 | 2.76 | 2.94 | 3.27 | 2.92 | 2.93 | 3.04 | 2.92 |
| expresstaxrefund | 3.04 | - | - | - | - | - | 2.72 | 2.94 | 2.97 | 3.15 | 3.26 | 3.17 | 3.01 | 3.20 | 2.95 | 3.14 | 3.28 | 3.18 | 3.54 | 3.79 | 3.21 | 3.59 | 3.86 | 3.04 |
| fileonline.1040 | 2.12 | - | - | - | - | - | 2.03 | 2.36 | 2.13 | 2.63 | 2.29 | 2.11 | 2.12 | 2.01 | 2.17 | 2.15 | 2.17 | 2.02 | 2.14 | 2.07 | 2.00 | 2.63 | 2.03 | 2.04 |
| freetaxusa | 4.55 | - | - | - | - | - | 4.96 | 4.69 | 4.62 | 4.61 | 4.70 | 4.62 | 4.65 | 4.64 | 4.62 | 4.57 | 4.80 | 4.59 | 4.77 | 4.58 | 4.61 | 4.65 | 4.61 | 4.66 |
| hrblock | 15.26 | - | - | - | - | - | 15.19 | 15.19 | 15.27 | 15.29 | 15.28 | 15.20 | 15.35 | 15.32 | 15.24 | 15.28 | 15.21 | 15.28 | 15.34 | 15.30 | 15.30 | 15.28 | 15.34 | 15.55 |
| libertytax | 15.05 | - | - | - | - | - | 18.28 | 18.36 | 17.47 | 17.35 | 18.33 | 17.36 | 14.92 | 14.85 | 14.99 | 14.44 | 14.79 | 14.29 | 14.54 | 14.60 | 14.95 | 14.95 | 14.59 | 14.52 |
| olt | 36.34 | - | - | - | - | - | 32.68 | 33.09 | 35.12 | 34.60 | 32.51 | 32.46 | 33.83 | 33.80 | 35.26 | 31.29 | 33.22 | 32.05 | 32.22 | 34.90 | 32.85 | 31.70 | 34.13 | 34.06 |
| taxact | 10.05 | - | - | - | - | - | 9.49 | 10.82 | 7.53 | 12.26 | 11.61 | 7.82 | 3.48 | 3.36 | 3.63 | 3.51 | 3.41 | 3.47 | 3.61 | 3.83 | 3.47 | 3.23 | 3.36 | 3.41 |
| taxslayer | 4.10 | - | - | - | - | - | 4.32 | 4.23 | 4.63 | 4.39 | 4.35 | 4.23 | 4.25 | 4.41 | 4.21 | 4.68 | 4.28 | 4.57 | 4.29 | 4.34 | 5.59 | 4.49 | 4.84 | 4.39 |
| turbotax | 7.71 | - | - | - | - | - | 5.90 | 5.67 | 7.59 | 7.45 | 8.29 | 10.57 | 7.38 | 5.54 | 6.07 | 6.76 | 6.61 | 4.56 | 4.42 | 5.20 | 7.54 | 6.91 | 6.43 | 6.90 |
Average response times by hour April 05, 2018 - April 18, 2018
| Target | Hours | |||||||||||||||||||||||
| 00 | 01 | 02 | 03 | 04 | 05 | 06 | 07 | 08 | 09 | 10 | 11 | 12 | 13 | 14 | 15 | 16 | 17 | 18 | 19 | 20 | 21 | 22 | 23 | |
| efile | 28.86 | - | - | - | - | - | 32.36 | 33.65 | 33.79 | 29.62 | 32.26 | 35.01 | 36.50 | 37.99 | 38.27 | 35.15 | 35.77 | 34.59 | 35.00 | 35.17 | 35.06 | 36.76 | 36.58 | 33.22 |
| esmarttax | 15.38 | - | - | - | - | - | 17.06 | 15.71 | 17.05 | 16.25 | 18.74 | 18.89 | 16.18 | 17.05 | 17.95 | 16.08 | 16.47 | 17.02 | 16.91 | 17.03 | 15.91 | 16.37 | 15.50 | 15.41 |
| etax | 3.12 | - | - | - | - | - | 2.66 | 2.74 | 2.93 | 2.81 | 3.04 | 2.85 | 3.09 | 3.30 | 3.21 | 3.17 | 3.39 | 3.69 | 3.08 | 3.27 | 3.25 | 3.12 | 3.33 | 3.59 |
| expresstaxrefund | 3.81 | - | - | - | - | - | 3.01 | 2.89 | 3.18 | 3.09 | 3.42 | 3.30 | 3.37 | 3.87 | 3.90 | 4.34 | 4.31 | 4.66 | 3.80 | 4.34 | 3.94 | 4.23 | 4.07 | 3.89 |
| fileonline.1040 | 2.49 | - | - | - | - | - | 2.34 | 2.43 | 2.47 | 2.47 | 2.44 | 2.30 | 2.41 | 2.42 | 2.34 | 2.42 | 2.46 | 2.34 | 2.35 | 2.34 | 2.39 | 2.41 | 2.38 | 2.34 |
| freetaxusa | 4.72 | - | - | - | - | - | 4.85 | 4.79 | 4.81 | 4.82 | 4.74 | 4.73 | 4.74 | 4.73 | 4.75 | 4.73 | 4.78 | 4.73 | 4.75 | 4.72 | 4.74 | 4.78 | 4.72 | 4.75 |
| hrblock | 15.43 | - | - | - | - | - | 15.24 | 15.27 | 15.31 | 15.34 | 15.35 | 15.40 | 15.45 | 15.38 | 15.52 | 15.39 | 15.49 | 15.48 | 15.46 | 15.36 | 15.43 | 15.58 | 15.90 | 15.62 |
| libertytax | 14.66 | 17.57 | - | - | - | - | 15.06 | 14.34 | 14.34 | 14.67 | 14.67 | 15.58 | 14.48 | 14.25 | 14.54 | 14.57 | 14.46 | 15.63 | 14.95 | 15.04 | 13.91 | 13.72 | 15.34 | 15.30 |
| olt | 36.47 | - | - | - | - | - | 33.23 | 33.03 | 33.61 | 33.83 | 32.54 | 33.13 | 33.57 | 34.15 | 33.92 | 36.95 | 38.35 | 36.56 | 37.55 | 37.00 | 38.40 | 39.94 | 39.54 | 55.64 |
| taxact | 5.18 | - | - | - | - | - | 6.01 | 5.77 | 5.73 | 5.64 | 5.36 | 5.52 | 5.22 | 5.08 | 5.89 | 6.07 | 5.75 | 5.62 | 5.61 | 5.59 | 5.53 | 6.00 | 5.71 | 5.65 |
| taxslayer | 8.06 | - | - | - | - | 12.26 | 6.13 | 6.12 | 6.72 | 6.28 | 7.86 | 7.12 | 6.53 | 6.45 | 7.33 | 7.56 | 6.87 | 7.42 | 7.25 | 7.97 | 6.98 | 7.78 | 7.04 | 8.24 |
| turbotax | 28.13 | - | - | - | - | 820.04 | 7.56 | 6.95 | 6.83 | 7.33 | 8.39 | 7.81 | 8.47 | 7.40 | 7.43 | 13.14 | 20.88 | 20.93 | 15.10 | 22.84 | 19.54 | 18.71 | 14.80 | 25.05 |
Uptime
Uptime April 18, 2018
| # | Target | San Francisco | Chicago | Washington | Avg. uptime |
|---|---|---|---|---|---|
| 1 | turbotax.com | 100.000% | 100.000% | 100.000% | 100.000% |
| 2 | taxslayer.com | 100.000% | 100.000% | 100.000% | 100.000% |
| 3 | etax.com | 100.000% | 100.000% | 100.000% | 100.000% |
| 4 | freetaxusa.com | 100.000% | 100.000% | 100.000% | 100.000% |
| 5 | olt.com | 100.000% | 100.000% | 100.000% | 100.000% |
| 6 | expresstaxrefund.com | 100.000% | 100.000% | 100.000% | 100.000% |
| 7 | fileonline.1040.com | 100.000% | 100.000% | 100.000% | 100.000% |
| 8 | hrblock.com | 100.000% | 100.000% | 100.000% | 100.000% |
| 9 | esmarttax.com | 98.550% | 100.000% | 100.000% | 99.517% |
| 10 | libertytax.com | 95.970% | 100.000% | 99.730% | 98.567% |
| 11 | efile.com | 89.040% | 99.710% | 100.000% | 96.250% |
| 12 | taxact.com | 88.940% | 99.510% | 99.590% | 96.013% |
Uptime April 05, 2018 - April 18, 2018
| # | Target | San Francisco | Chicago | Washington | Avg. uptime |
|---|---|---|---|---|---|
| 1 | hrblock.com | 100.000% | 100.000% | 100.000% | 100.000% |
| 2 | freetaxusa.com | 100.000% | 100.000% | 100.000% | 100.000% |
| 3 | fileonline.1040.com | 100.000% | 100.000% | 99.986% | 99.995% |
| 4 | etax.com | 99.514% | 100.000% | 100.000% | 99.838% |
| 5 | expresstaxrefund.com | 98.662% | 100.000% | 100.000% | 99.554% |
| 6 | turbotax.com | 97.109% | 100.000% | 100.000% | 99.036% |
| 7 | taxslayer.com | 96.632% | 99.897% | 99.864% | 98.798% |
| 8 | esmarttax.com | 97.250% | 99.499% | 99.505% | 98.751% |
| 9 | olt.com | 97.286% | 99.313% | 98.494% | 98.364% |
| 10 | libertytax.com | 94.685% | 99.025% | 99.332% | 97.681% |
| 11 | efile.com | 91.926% | 99.614% | 99.689% | 97.076% |
| 12 | taxact.com | 88.417% | 99.624% | 98.999% | 95.680% |
Methodology:
The 2018 Tax Reports reflect a complete web transaction, representative for the End Users' interactions with a website. The reporting period covers the dates between April 05 and April 18, 2018. Performance and availability measurements are made for a typical multi-step web transaction at 15 minute monitoring interval, every day between the hours of 6AM and 3AM EST. Between 3AM and 6AM is the time when a scheduled maintenance most likely will be performed by IT staff and that is why we automatically suspend the monitoring process during this time every day. The WebSitePulse application monitoring service is used to collect data and to create the reports.
The steps in each transaction are comparable for all websites, and reflect the real online user and tax e-filer experience. The simultaneous monitoring is performed from 3 US-based locations of the WebSitePulse monitoring network: San Francisco, CA, Chicago, IL, and Washington, DC. In case of a detected malfunction or unavailability, the system performs automated error verification from 3 independent resources and only after the above procedure is performed and has returned consistent results, the detected error is confirmed, recorded, and included in the daily performance reports. In these cases, an advanced WebSitePulse exclusive feature comes into play - Forced Monitoring -, which automatically switches to a 3 minute monitoring interval for increased accuracy.
About WebSitePulse:
WebSitePulse is a leading provider of global, independent, and objective availability and performance monitoring of web sites, servers, network components, web applications, e-business- and email round-trip transactions.
Contact:
For more information about this report please contact:
George T., CTO
phone: 1-407-380-1600
email:
Reproduction:
WebSitePulse launched the Performance and Uptime Reports program to keep the general public and the Internet community informed about the performance of specific websites and the challenges their webmasters, owners and operators are facing on a daily basis, especially when the web traffic intensifies due to some special events through the year. Some of the most popular web destinations, related to each particular event, are selected for the purpose of the Reports, and data from their performance measurements is made available on the WebSitePulse public website.
With the intention to broadly disseminate this information for the benefit of the Internet community, we encourage the use of this information without prior approval and under the following Terms and Conditions:
- WebSitePulse should be referred as the "Source" of the information;
- WebSitePulse should be acknowledged as the owner of the copyrights of the information in the Reports;
- The texts of the Reports could be changed or altered to better suit the needs and the style of the publisher without prior notice to WebSitePulse. However, the integrity and the meaning of the information should be preserved;
The Data from the performance measurements cannot be changed or manipulated and should be used "as is".