
Performance Tracking > 2020 Holiday Season
WebSitePulse reports the following results from web performance measurement of the websites participating in the the Holiday Retail Performance and Uptime Report:
The daily Average Response time from all monitored websites was 3.109 sec.
The typical shopping transaction took the least time for samsclub.com visitors - 1.603 sec., while the visitors of officedepot.com had to be the most patient, as the shopping transaction there took in average of 4.959 sec.
Four of the monitored websites delivered above-the-average response times for their transactions, while six of them demonstrated below-the-average daily performance.
The daily Average Uptime for the entire Group was 100%.
All websites were available with no interruptions.
Report Highlights
No events of particular importance or possible negative impact on the online visitors' interaction with the Websites included into the 2020 Holiday Season report were detected during the reported period, and according to WebSitePulse, the Group delivered the expected levels of End-User experience and Customer satisfaction.
Please, scroll down for Detailed Reports and Charts provided by WebSitePulse:
Daily Response Times
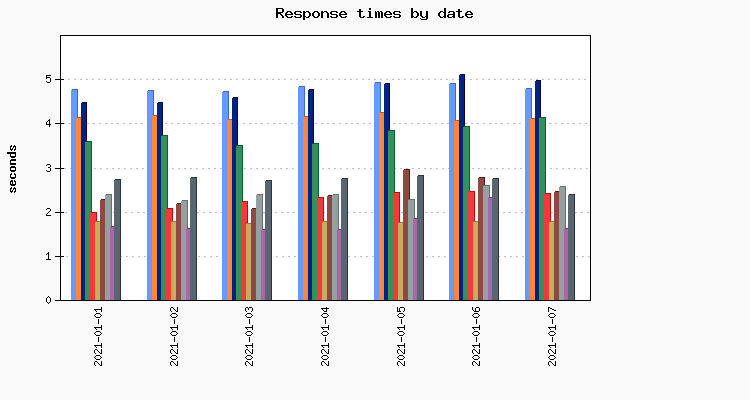
Average Response Times for January 07, 2021
Average Response Times November 20, 2020 - January 07, 2021
Hourly Average Response Times
Select individual website to display:
Average response times by hour for January 07, 2021
Average response times by hour November 20, 2020 - January 07, 2021
Uptime
Uptime January 07, 2021
Uptime November 20, 2020 - January 07, 2021
Methodology:
The 2020 Holiday Season Reports reflect a complete web transaction, representative for the End Users' interactions with a website. The reporting period covers the dates between November 20, 2020 and January 6, 2021. Performance and availability measurements are made for a typical multi-step web transaction at 15 minute monitoring interval, every day 24/7. The WebSitePulse application monitoring service is used to collect data and to create the reports.
The steps in each transaction are comparable for all websites, and reflect the real online shopper experience. The simultaneous monitoring is performed from 3 US-based locations of the WebSitePulse monitoring network: Los Angeles, CA, Chicago, IL, and Washington, DC. In case of a detected malfunction or unavailability, the system performs automated error verification from 3 independent resources and only after the above procedure is performed and has returned consistent results, the detected error is confirmed, recorded, and included in the daily performance reports. In these cases, an advanced WebSitePulse exclusive feature comes into play - Forced Monitoring -, which automatically switches to a 3 minute monitoring interval for increased accuracy.
About WebSitePulse:
WebSitePulse is a leading provider of global, independent, and objective availability and performance monitoring of web sites, servers, network components, web applications, e-business- and email round-trip transactions.
Contact:
For more information about this report please contact:
George T., CTO
phone: 1-407-380-1600
email:
Reproduction:
WebSitePulse launched the Performance and Uptime Reports program to keep the general public and the Internet community informed about the performance of specific websites and the challenges their webmasters, owners and operators are facing on a daily basis, especially when the web traffic intensifies due to some special events through the year. Some of the most popular web destinations, related to each particular event, are selected for the purpose of the Reports, and data from their performance measurements is made available on the WebSitePulse public website.
With the intention to broadly disseminate this information for the benefit of the Internet community, we encourage the use of this information without prior approval and under the following Terms and Conditions:
The Data from the performance measurements cannot be changed or manipulated and should be used "as is".
WebSitePulse 2020 Holiday Retail Performance and Uptime Report
Even in hard times like these, we look forward to the most important family holidays of the year. The Christmas season, also known as the Holiday season, is an annually recurring period usually considered to run from November to early January, with Black Friday traditionally been the kickoff of the holiday shopping season. However, many retailers are predicting this year's holiday shopping will start earlier.
Due to the Coronavirus pandemic, many stores will have COVID-19 restrictions that would limit the working hours and stores' capacity. That would lead to an increase in online purchases. It is expected holiday e-commerce sales to surge by 25% to 35%, amounting to between $182 billion and $196 billion. That compared with year-over-year growth online of 14.7% in 2019, with sales reaching $145 billion, according to Deloitte.
Another important day in the holiday shopping season is Cyber Monday. According to blackfriday.com, Cyber Monday 2020 e-commerce sales will hit 10 billion. That's an increase of $9.4 billion in spending over 2019.
Expecting a higher demand and heavier traffic, online retailers need to keep a close eye on their websites, servers, and web assets to meet online shoppers' growing needs.
For the 15th year in a row, WebSitePulse will monitor 12 of the most popular shopping websites. The 2020 Holiday Retail Performance and Uptime Report measures the websites' uptime and response time as the most critical metrics for the availability and the reliability of any web store.
WebSitePulse will simultaneously make measurements of web transactions every 15 minutes from 3 different monitoring locations. In-depth analytical information is also collected and stored in the WebSitePulse system for future references.
| Daily Report for January 07, 2021 | See report for: |
WebSitePulse reports the following results from web performance measurement of the websites participating in the the Holiday Retail Performance and Uptime Report:
The daily Average Response time from all monitored websites was 3.109 sec.
| The Average Response time as measured from the US East Coast (Washington DC) was: | 2.735 sec. |
| The Average Response time as measured from the US West Coast (Los Angeles, CA) was: | 3.600 sec. |
| The Average Response time as measured from the US Central was (Chicago, IL): | 2.993 sec. |
| The Best Response time measured from US East Coast (Washington DC): | 1.078 sec. |
| The Best Response time measured from US West Coast (Los Angeles, CA): | 1.638 sec. |
| The Best Response time measured from US Central was (Chicago, IL): | 1.266 sec. |
The typical shopping transaction took the least time for samsclub.com visitors - 1.603 sec., while the visitors of officedepot.com had to be the most patient, as the shopping transaction there took in average of 4.959 sec.
Four of the monitored websites delivered above-the-average response times for their transactions, while six of them demonstrated below-the-average daily performance.
The daily Average Uptime for the entire Group was 100%.
All websites were available with no interruptions.
Report Highlights
No events of particular importance or possible negative impact on the online visitors' interaction with the Websites included into the 2020 Holiday Season report were detected during the reported period, and according to WebSitePulse, the Group delivered the expected levels of End-User experience and Customer satisfaction.
Please, scroll down for Detailed Reports and Charts provided by WebSitePulse:
Daily Response Times
| Legend: | ||||
| amazon | hallmark | officedepot | cdw | costco |
| bathandbodyworks | barnesandnoble | michaels | samsclub | belk |
Average Response Times for January 07, 2021
| # | Target | Los Angeles | Chicago | Washington | Avg. resp. time |
|---|---|---|---|---|---|
| 1 | samsclub.com | 1.638 | 1.843 | 1.329 | 1.603 |
| 2 | bathandbodyworks.com | 2.942 | 1.266 | 1.078 | 1.762 |
| 3 | belk.com | 3.032 | 1.934 | 2.151 | 2.372 |
| 4 | costco.com | 2.619 | 2.698 | 1.857 | 2.391 |
| 5 | barnesandnoble.com | 2.799 | 2.517 | 2.021 | 2.446 |
| 6 | michaels.com | 3.262 | 2.640 | 1.805 | 2.569 |
| 7 | hallmark.com | 3.841 | 3.693 | 4.787 | 4.107 |
| 8 | cdw.com | 4.949 | 3.834 | 3.559 | 4.114 |
| 9 | amazon.com | 5.548 | 4.668 | 4.095 | 4.770 |
| 10 | officedepot.com | 5.375 | 4.836 | 4.665 | 4.959 |
Average Response Times November 20, 2020 - January 07, 2021
| # | Target | Los Angeles | Chicago | Washington | Avg. resp. time |
|---|---|---|---|---|---|
| 1 | samsclub.com | 1.862 | 1.836 | 1.535 | 1.744 |
| 2 | bathandbodyworks.com | 3.184 | 1.476 | 1.240 | 1.967 |
| 3 | costco.com | 2.486 | 2.172 | 1.945 | 2.201 |
| 4 | barnesandnoble.com | 2.571 | 2.126 | 1.987 | 2.228 |
| 5 | michaels.com | 3.082 | 2.266 | 1.909 | 2.419 |
| 6 | belk.com | 3.410 | 2.190 | 2.997 | 2.865 |
| 7 | cdw.com | 4.420 | 3.549 | 3.335 | 3.768 |
| 8 | hallmark.com | 3.912 | 3.743 | 4.656 | 4.104 |
| 9 | officedepot.com | 5.344 | 4.717 | 4.728 | 4.930 |
| 10 | amazon.com | 5.886 | 4.864 | 4.351 | 5.033 |
Hourly Average Response Times
Select individual website to display:
| Legend: | |
| individual site response times | monitored group average response times |
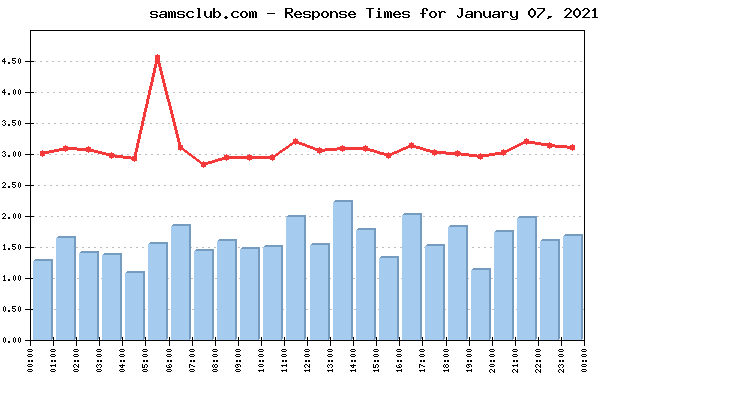
Average response times by hour for January 07, 2021
| Target | Hours | |||||||||||||||||||||||
| 00 | 01 | 02 | 03 | 04 | 05 | 06 | 07 | 08 | 09 | 10 | 11 | 12 | 13 | 14 | 15 | 16 | 17 | 18 | 19 | 20 | 21 | 22 | 23 | |
| amazon | 4.92 | 5.05 | 5.09 | 4.47 | 4.55 | 4.40 | 4.67 | 4.49 | 4.55 | 4.61 | 4.64 | 4.83 | 4.66 | 4.71 | 4.79 | 4.82 | 4.74 | 4.80 | 4.84 | 4.85 | 4.88 | 5.07 | 5.09 | 4.95 |
| barnesandnoble | 2.47 | 2.49 | 2.28 | 2.12 | 2.35 | 1.79 | 2.76 | 2.24 | 2.84 | 2.73 | 2.00 | 2.66 | 2.45 | 2.45 | 2.53 | 2.38 | 2.58 | 2.61 | 2.34 | 2.18 | 3.04 | 2.65 | 2.34 | 2.41 |
| bathandbodyworks | 1.80 | 1.84 | 1.71 | 1.84 | 1.87 | 1.87 | 1.99 | 1.63 | 1.81 | 1.84 | 1.61 | 1.80 | 1.69 | 1.55 | 1.73 | 1.83 | 1.60 | 1.79 | 1.68 | 1.56 | 1.70 | 1.82 | 1.80 | 1.91 |
| belk | 2.37 | 2.65 | 2.46 | 2.52 | 2.58 | 2.25 | 2.85 | 2.35 | 2.40 | 2.24 | 2.24 | 2.41 | 2.62 | 2.34 | 2.24 | 2.30 | 2.36 | 2.12 | 2.34 | 2.42 | 2.33 | 2.09 | 2.22 | 2.21 |
| cdw | 3.16 | 3.57 | 3.31 | 3.44 | 3.27 | 19.74 | 2.93 | 3.11 | 3.24 | 3.04 | 3.90 | 3.72 | 3.35 | 3.57 | 3.52 | 3.35 | 3.84 | 3.52 | 3.29 | 3.35 | 3.17 | 3.84 | 3.47 | 4.06 |
| costco | 2.43 | 2.39 | 2.22 | 2.43 | 2.55 | 2.13 | 2.47 | 2.24 | 2.02 | 2.66 | 2.13 | 2.20 | 2.25 | 2.58 | 2.47 | 2.62 | 2.51 | 2.69 | 2.45 | 2.51 | 2.17 | 2.47 | 2.66 | 2.15 |
| hallmark | 4.02 | 3.98 | 4.60 | 4.65 | 4.27 | 4.28 | 4.01 | 3.81 | 3.88 | 3.75 | 4.32 | 4.10 | 3.90 | 4.07 | 4.17 | 3.84 | 3.80 | 4.23 | 3.89 | 4.27 | 4.11 | 4.52 | 4.24 | 3.86 |
| michaels | 2.78 | 2.54 | 2.45 | 2.27 | 2.00 | 2.86 | 2.71 | 2.13 | 2.11 | 2.18 | 2.43 | 3.38 | 2.99 | 2.59 | 2.50 | 2.41 | 2.93 | 2.40 | 2.66 | 2.58 | 2.51 | 2.82 | 2.47 | 2.97 |
| officedepot | 5.02 | 4.77 | 5.25 | 4.75 | 4.89 | 4.73 | 4.96 | 4.92 | 5.06 | 4.95 | 4.77 | 5.01 | 5.24 | 4.89 | 5.24 | 5.07 | 5.16 | 4.69 | 4.81 | 4.81 | 4.68 | 4.89 | 5.48 | 4.97 |
| samsclub | 1.28 | 1.65 | 1.40 | 1.37 | 1.08 | 1.55 | 1.84 | 1.44 | 1.60 | 1.47 | 1.50 | 1.98 | 1.54 | 2.23 | 1.77 | 1.32 | 2.02 | 1.51 | 1.82 | 1.13 | 1.75 | 1.96 | 1.59 | 1.67 |
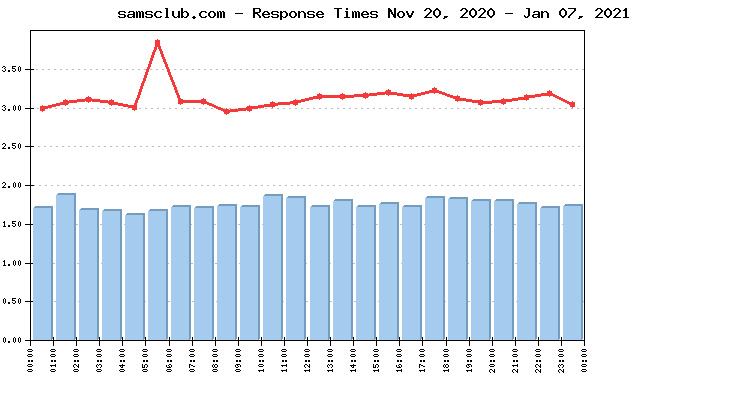
Average response times by hour November 20, 2020 - January 07, 2021
| Target | Hours | |||||||||||||||||||||||
| 00 | 01 | 02 | 03 | 04 | 05 | 06 | 07 | 08 | 09 | 10 | 11 | 12 | 13 | 14 | 15 | 16 | 17 | 18 | 19 | 20 | 21 | 22 | 23 | |
| amazon | 5.14 | 5.09 | 4.89 | 4.85 | 4.87 | 4.75 | 4.74 | 4.71 | 4.79 | 4.85 | 4.92 | 5.00 | 5.10 | 5.13 | 5.12 | 5.15 | 5.17 | 5.16 | 5.20 | 5.18 | 5.24 | 5.24 | 5.33 | 5.21 |
| barnesandnoble | 2.16 | 2.34 | 2.16 | 2.13 | 2.04 | 1.86 | 2.03 | 2.09 | 2.07 | 2.32 | 2.16 | 2.21 | 2.24 | 2.25 | 2.27 | 2.30 | 2.36 | 2.47 | 2.37 | 2.30 | 2.33 | 2.32 | 2.43 | 2.24 |
| bathandbodyworks | 1.70 | 1.70 | 1.70 | 1.74 | 1.79 | 1.78 | 1.76 | 2.60 | 2.32 | 2.48 | 2.63 | 2.54 | 2.46 | 2.57 | 2.06 | 1.71 | 1.72 | 1.74 | 1.68 | 1.70 | 1.71 | 1.73 | 1.69 | 1.70 |
| belk | 2.81 | 3.04 | 3.64 | 2.69 | 2.80 | 2.77 | 3.63 | 3.00 | 2.81 | 2.74 | 2.70 | 2.79 | 2.77 | 2.80 | 2.73 | 2.76 | 2.73 | 2.79 | 2.78 | 2.74 | 2.82 | 2.84 | 2.83 | 2.76 |
| cdw | 3.17 | 3.21 | 3.46 | 3.50 | 3.34 | 12.14 | 3.17 | 3.18 | 2.98 | 2.88 | 3.21 | 3.23 | 3.96 | 3.59 | 3.32 | 3.52 | 3.38 | 3.91 | 3.69 | 3.35 | 3.49 | 3.59 | 3.79 | 3.37 |
| costco | 1.90 | 2.13 | 2.13 | 2.19 | 2.25 | 2.16 | 2.80 | 2.39 | 1.90 | 1.93 | 1.99 | 2.05 | 2.13 | 2.23 | 2.50 | 2.42 | 2.27 | 2.50 | 2.27 | 2.20 | 2.11 | 2.14 | 2.18 | 2.01 |
| hallmark | 4.11 | 4.18 | 4.39 | 4.98 | 4.34 | 4.13 | 3.99 | 3.95 | 3.94 | 3.92 | 3.96 | 4.07 | 3.97 | 4.00 | 4.07 | 3.94 | 3.92 | 3.98 | 4.08 | 4.02 | 4.09 | 4.16 | 4.22 | 4.10 |
| michaels | 2.44 | 2.34 | 2.40 | 2.21 | 2.16 | 2.75 | 2.55 | 2.21 | 2.06 | 2.08 | 2.25 | 2.33 | 2.42 | 2.37 | 2.37 | 2.54 | 2.38 | 2.46 | 2.56 | 2.68 | 2.53 | 2.74 | 2.74 | 2.49 |
| officedepot | 4.85 | 4.81 | 4.62 | 4.72 | 4.89 | 4.38 | 4.55 | 5.00 | 4.98 | 5.07 | 4.68 | 4.69 | 4.72 | 4.77 | 5.44 | 5.92 | 5.88 | 5.47 | 4.77 | 4.78 | 4.72 | 4.90 | 4.95 | 4.75 |
| samsclub | 1.70 | 1.87 | 1.68 | 1.67 | 1.61 | 1.66 | 1.72 | 1.70 | 1.73 | 1.72 | 1.86 | 1.83 | 1.71 | 1.80 | 1.72 | 1.76 | 1.72 | 1.83 | 1.82 | 1.79 | 1.79 | 1.75 | 1.70 | 1.73 |
Uptime
Uptime January 07, 2021
| # | Target | Los Angeles | Chicago | Washington | Avg. uptime |
|---|---|---|---|---|---|
| 1 | barnesandnoble.com | 100.000% | 100.000% | 100.000% | 100.000% |
| 2 | michaels.com | 100.000% | 100.000% | 100.000% | 100.000% |
| 3 | samsclub.com | 100.000% | 100.000% | 100.000% | 100.000% |
| 4 | belk.com | 100.000% | 100.000% | 100.000% | 100.000% |
| 5 | bathandbodyworks.com | 100.000% | 100.000% | 100.000% | 100.000% |
| 6 | costco.com | 100.000% | 100.000% | 100.000% | 100.000% |
| 7 | hallmark.com | 100.000% | 100.000% | 100.000% | 100.000% |
| 8 | cdw.com | 100.000% | 100.000% | 100.000% | 100.000% |
| 9 | amazon.com | 100.000% | 100.000% | 100.000% | 100.000% |
| 10 | officedepot.com | 100.000% | 100.000% | 99.920% | 99.973% |
Uptime November 20, 2020 - January 07, 2021
| # | Target | Los Angeles | Chicago | Washington | Avg. uptime |
|---|---|---|---|---|---|
| 1 | amazon.com | 100.000% | 100.000% | 100.000% | 100.000% |
| 2 | belk.com | 100.000% | 99.996% | 100.000% | 99.999% |
| 3 | hallmark.com | 100.000% | 100.000% | 99.994% | 99.998% |
| 4 | barnesandnoble.com | 99.994% | 100.000% | 99.990% | 99.995% |
| 5 | costco.com | 99.994% | 99.994% | 99.988% | 99.992% |
| 6 | bathandbodyworks.com | 99.978% | 99.939% | 99.960% | 99.959% |
| 7 | cdw.com | 99.973% | 99.959% | 99.928% | 99.953% |
| 8 | michaels.com | 99.942% | 99.929% | 99.954% | 99.942% |
| 9 | officedepot.com | 99.802% | 99.851% | 99.832% | 99.828% |
| 10 | samsclub.com | 99.967% | 99.699% | 99.547% | 99.738% |
Methodology:
The 2020 Holiday Season Reports reflect a complete web transaction, representative for the End Users' interactions with a website. The reporting period covers the dates between November 20, 2020 and January 6, 2021. Performance and availability measurements are made for a typical multi-step web transaction at 15 minute monitoring interval, every day 24/7. The WebSitePulse application monitoring service is used to collect data and to create the reports.
The steps in each transaction are comparable for all websites, and reflect the real online shopper experience. The simultaneous monitoring is performed from 3 US-based locations of the WebSitePulse monitoring network: Los Angeles, CA, Chicago, IL, and Washington, DC. In case of a detected malfunction or unavailability, the system performs automated error verification from 3 independent resources and only after the above procedure is performed and has returned consistent results, the detected error is confirmed, recorded, and included in the daily performance reports. In these cases, an advanced WebSitePulse exclusive feature comes into play - Forced Monitoring -, which automatically switches to a 3 minute monitoring interval for increased accuracy.
About WebSitePulse:
WebSitePulse is a leading provider of global, independent, and objective availability and performance monitoring of web sites, servers, network components, web applications, e-business- and email round-trip transactions.
Contact:
For more information about this report please contact:
George T., CTO
phone: 1-407-380-1600
email:
Reproduction:
WebSitePulse launched the Performance and Uptime Reports program to keep the general public and the Internet community informed about the performance of specific websites and the challenges their webmasters, owners and operators are facing on a daily basis, especially when the web traffic intensifies due to some special events through the year. Some of the most popular web destinations, related to each particular event, are selected for the purpose of the Reports, and data from their performance measurements is made available on the WebSitePulse public website.
With the intention to broadly disseminate this information for the benefit of the Internet community, we encourage the use of this information without prior approval and under the following Terms and Conditions:
- WebSitePulse should be referred as the "Source" of the information;
- WebSitePulse should be acknowledged as the owner of the copyrights of the information in the Reports;
- The texts of the Reports could be changed or altered to better suit the needs and the style of the publisher without prior notice to WebSitePulse. However, the integrity and the meaning of the information should be preserved;
The Data from the performance measurements cannot be changed or manipulated and should be used "as is".