
Performance Tracking > 2023 Holiday Season
WebSitePulse reports the following results from web performance measurement of the websites participating in the the Holiday Retail Performance and Uptime Report:
The daily Average Response time from all monitored websites was 6.196 sec.
The typical shopping transaction took the least time for biglots.com visitors - 2.214 sec., while the visitors of costco.com had to be the most patient, as the shopping transaction there took in average of 13.141 sec.
Four of the monitored websites delivered above-the-average response times for their transactions, while six of them demonstrated below-the-average daily performance.
The daily average uptime for the entire Group was 99.89%.
Seven websites were available with no interruptions - 100%.
Nine websites' availability was above the average, while one site dragged the average down with below-the-average availability.
Report Highlights
No events of particular importance or possible negative impact on the online visitors' interaction with the Websites included into the 2023 Holiday Season report were detected during the reported period, and according to WebSitePulse, the Group delivered the expected levels of End-User experience and Customer satisfaction.
Please, scroll down for Detailed Reports and Charts provided by WebSitePulse:
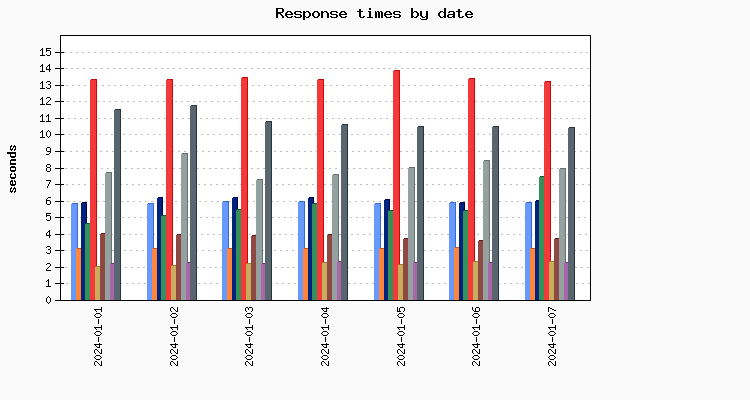
Daily Response Times
Average Response Times for January 07, 2024
Average Response Times November 21, 2023 - January 07, 2024
Hourly Average Response Times
Select individual website to display:
Average response times by hour for January 07, 2024
Average response times by hour November 21, 2023 - January 07, 2024
Uptime
Uptime January 07, 2024
Uptime November 21, 2023 - January 07, 2024
Methodology:
The 2023 Holiday Season Reports reflect a complete web transaction, representative for the End Users' interactions with a website. The reporting period covers the dates between November 21, 2023 and January 7, 2024 Performance and availability measurements are made for a typical multi-step web transaction at 15 minute monitoring interval, every day 24/7. The WebSitePulse application monitoring service is used to collect data and to create the reports.
The steps in each transaction are comparable for all websites, and reflect the real online shopper experience. The simultaneous monitoring is performed from 3 US-based locations of the WebSitePulse monitoring network: Los Angeles, CA, Chicago, IL, and Washington, DC. In case of a detected malfunction or unavailability, the system performs automated error verification from 3 independent resources and only after the above procedure is performed and has returned consistent results, the detected error is confirmed, recorded, and included in the daily performance reports. In these cases, an advanced WebSitePulse exclusive feature comes into play - Forced Monitoring -, which automatically switches to a 3 minute monitoring interval for increased accuracy.
About WebSitePulse:
WebSitePulse is a leading provider of global, independent, and objective availability and performance monitoring of web sites, servers, network components, web applications, e-business- and email round-trip transactions.
Contact:
For more information about this report please contact:
George T., CTO
phone: 1-407-380-1600
email:
Reproduction:
WebSitePulse launched the Performance and Uptime Reports program to keep the general public and the Internet community informed about the performance of specific websites and the challenges their webmasters, owners and operators are facing on a daily basis, especially when the web traffic intensifies due to some special events through the year. Some of the most popular web destinations, related to each particular event, are selected for the purpose of the Reports, and data from their performance measurements is made available on the WebSitePulse public website.
With the intention to broadly disseminate this information for the benefit of the Internet community, we encourage the use of this information without prior approval and under the following Terms and Conditions:
The Data from the performance measurements cannot be changed or manipulated and should be used "as is".
WebSitePulse 2023 Holiday Retail Performance and Uptime Report
The Holiday season 2023 is upon us. It is a magical time marked by twinkling lights, festive
decorations, and a spirit of joy and generosity. It's a period rich in traditions and customs, bringing
together family and friends in celebration. Amidst the merriment, there's a deeper meaning of
togetherness, gratitude, and hope. As we immerse ourselves in this festive time, let's spread its
warmth and cheer to all around us.
The Holiday season starts on Black Friday and Cyber Monday, peaks at Christmas, and ends shortly after New Year's Eve.
PwC's 2023 Holiday Outlook reveals that consumers plan to increase their spending by 7%, allocating an average of $1,530 for gifts, travel, and entertainment. This increase is also reflected in travel- related spending, which is expected to surge by 12% over the 2022 holiday season. Notably, almost 40% of consumers intend to spend more than last year, with high-income households (those earning $120,000 or more) likely to spend over $3,000.
The holiday season is crucial for online retailers due to increased consumer spending on gifts and festive items. The convenience of online shopping, especially during busy times, attracts customers. Retailers capitalize on this by offering holiday-specific sales and promotions like Black Friday and Cyber Monday deals. The growing popularity of gift cards and e-gifting options further boosts online sales.
For the 18th year, WebSitePulse will monitor 12 popular shopping websites. The 2023 Holiday Retail Performance and Uptime Report measures the websites' uptime and response time as the most critical metrics for any website's availability and reliability.
WebSitePulse will measure web transactions every 15 minutes from 3 different monitoring locations. In-depth analytical information is also collected and stored in the WebSitePulse system for future reference.
| Daily Report for January 07, 2024 | See report for: |
WebSitePulse reports the following results from web performance measurement of the websites participating in the the Holiday Retail Performance and Uptime Report:
The daily Average Response time from all monitored websites was 6.196 sec.
| The Average Response time as measured from the US East Coast (Washington DC) was: | 5.967 sec. |
| The Average Response time as measured from the US West Coast (Los Angeles, CA) was: | 6.390 sec. |
| The Average Response time as measured from the US Central was (Chicago, IL): | 6.230 sec. |
| The Best Response time measured from US East Coast (Washington DC): | 1.878 sec. |
| The Best Response time measured from US West Coast (Los Angeles, CA): | 2.058 sec. |
| The Best Response time measured from US Central was (Chicago, IL): | 2.195 sec. |
The typical shopping transaction took the least time for biglots.com visitors - 2.214 sec., while the visitors of costco.com had to be the most patient, as the shopping transaction there took in average of 13.141 sec.
Four of the monitored websites delivered above-the-average response times for their transactions, while six of them demonstrated below-the-average daily performance.
The daily average uptime for the entire Group was 99.89%.
| The Average Uptime as measured from the US East Coast (Washington DC) was: | 99.85% |
| The Average Uptime as measured from the US West Coast (Los Angeles, CA) was: | 99.91% |
| The Average Uptime as measured from the US Central (Chicago, IL): | 99.92% |
Seven websites were available with no interruptions - 100%.
Nine websites' availability was above the average, while one site dragged the average down with below-the-average availability.
Report Highlights
No events of particular importance or possible negative impact on the online visitors' interaction with the Websites included into the 2023 Holiday Season report were detected during the reported period, and according to WebSitePulse, the Group delivered the expected levels of End-User experience and Customer satisfaction.
Please, scroll down for Detailed Reports and Charts provided by WebSitePulse:
Daily Response Times
| Legend: | ||||
| amazon | hallmark | officedepot | cdw | costco |
| michaels | gobros | rileyhome | biglots | la-z-boy |
Average Response Times for January 07, 2024
| # | Target | Los Angeles | Chicago | Washington | Avg. resp. time |
|---|---|---|---|---|---|
| 1 | biglots.com | 2.569 | 2.195 | 1.878 | 2.214 |
| 2 | michaels.com | 2.058 | 2.738 | 2.052 | 2.283 |
| 3 | hallmark.com | 3.111 | 3.010 | 3.039 | 3.053 |
| 4 | gobros.com | 4.009 | 3.362 | 3.686 | 3.686 |
| 5 | amazon.com | 6.252 | 5.822 | 5.542 | 5.872 |
| 6 | officedepot.com | 5.860 | 6.402 | 5.675 | 5.979 |
| 7 | cdw.com | 7.490 | 7.589 | 7.139 | 7.406 |
| 8 | rileyhome.com | 8.870 | 7.761 | 7.146 | 7.926 |
| 9 | la-z-boy.com | 10.170 | 10.512 | 10.508 | 10.397 |
| 10 | costco.com | 13.512 | 12.909 | 13.002 | 13.141 |
Average Response Times November 21, 2023 - January 07, 2024
| # | Target | Los Angeles | Chicago | Washington | Avg. resp. time |
|---|---|---|---|---|---|
| 1 | michaels.com | 1.975 | 2.477 | 1.881 | 2.111 |
| 2 | biglots.com | 2.597 | 2.260 | 1.926 | 2.261 |
| 3 | hallmark.com | 3.238 | 3.133 | 3.256 | 3.209 |
| 4 | gobros.com | 4.187 | 3.520 | 3.903 | 3.870 |
| 5 | cdw.com | 5.443 | 5.581 | 5.074 | 5.366 |
| 6 | amazon.com | 6.453 | 5.858 | 5.580 | 5.964 |
| 7 | officedepot.com | 6.049 | 6.497 | 5.848 | 6.131 |
| 8 | la-z-boy.com | 8.280 | 7.926 | 6.453 | 7.553 |
| 9 | rileyhome.com | 8.967 | 8.424 | 8.274 | 8.555 |
| 10 | costco.com | 13.098 | 13.412 | 12.960 | 13.157 |
Hourly Average Response Times
Select individual website to display:
| Legend: | |
| individual site response times | monitored group average response times |
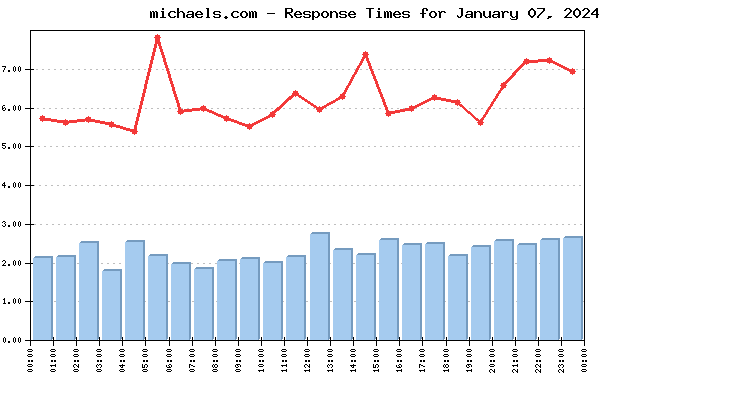
Average response times by hour for January 07, 2024
| Target | Hours | |||||||||||||||||||||||
| 00 | 01 | 02 | 03 | 04 | 05 | 06 | 07 | 08 | 09 | 10 | 11 | 12 | 13 | 14 | 15 | 16 | 17 | 18 | 19 | 20 | 21 | 22 | 23 | |
| amazon | 6.07 | 5.98 | 5.93 | 5.72 | 5.68 | 5.55 | 5.56 | 6.05 | 5.78 | 5.87 | 5.89 | 5.90 | 5.89 | 5.98 | 5.84 | 5.70 | 5.96 | 5.89 | 5.75 | 5.70 | 5.79 | 6.25 | 6.09 | 6.09 |
| biglots | 2.72 | 2.18 | 2.13 | 1.95 | 2.21 | 2.20 | 2.41 | 2.14 | 2.19 | 2.19 | 2.34 | 2.21 | 2.40 | 2.22 | 2.07 | 2.18 | 2.08 | 2.22 | 2.09 | 2.00 | 2.22 | 2.28 | 2.28 | 2.25 |
| cdw | 4.88 | 4.32 | 4.21 | 4.47 | 3.90 | 27.47 | 5.88 | 5.93 | 3.72 | 4.29 | 3.95 | 6.03 | 4.11 | 4.23 | 3.95 | 4.58 | 4.69 | 4.54 | 6.20 | 4.88 | 13.51 | 16.03 | 19.33 | 12.64 |
| costco | 13.12 | 13.12 | 13.34 | 13.98 | 13.04 | 12.90 | 13.72 | 12.88 | 13.76 | 13.14 | 11.97 | 12.01 | 12.24 | 12.80 | 23.90 | 12.53 | 12.86 | 12.03 | 12.04 | 11.71 | 11.66 | 11.89 | 12.18 | 12.54 |
| gobros | 3.98 | 4.38 | 3.68 | 3.10 | 2.87 | 2.62 | 3.60 | 3.47 | 3.44 | 3.65 | 3.73 | 3.99 | 4.05 | 4.25 | 4.18 | 3.81 | 3.62 | 3.75 | 3.64 | 4.12 | 3.70 | 3.53 | 3.35 | 3.94 |
| hallmark | 2.98 | 3.00 | 3.07 | 3.12 | 2.96 | 3.05 | 3.04 | 2.94 | 2.95 | 2.99 | 3.05 | 2.95 | 2.96 | 3.01 | 2.93 | 3.44 | 2.99 | 3.05 | 3.27 | 2.96 | 3.00 | 3.24 | 3.28 | 3.04 |
| la-z-boy | 7.34 | 8.50 | 9.30 | 9.19 | 8.30 | 9.90 | 9.51 | 11.55 | 10.47 | 8.45 | 12.54 | 13.60 | 12.55 | 10.66 | 8.84 | 10.37 | 11.46 | 15.85 | 13.03 | 7.88 | 8.66 | 11.89 | 8.60 | 11.07 |
| michaels | 2.12 | 2.15 | 2.51 | 1.77 | 2.53 | 2.17 | 1.96 | 1.83 | 2.04 | 2.09 | 1.98 | 2.14 | 2.74 | 2.31 | 2.19 | 2.57 | 2.44 | 2.49 | 2.16 | 2.40 | 2.56 | 2.44 | 2.58 | 2.62 |
| officedepot | 6.09 | 5.77 | 5.64 | 5.82 | 5.25 | 5.52 | 5.90 | 5.65 | 5.91 | 5.68 | 5.85 | 6.64 | 5.78 | 5.87 | 6.01 | 6.14 | 5.96 | 5.92 | 6.02 | 6.38 | 6.11 | 6.16 | 6.28 | 7.14 |
| rileyhome | 8.00 | 6.85 | 7.26 | 6.69 | 7.14 | 6.74 | 7.41 | 7.43 | 7.00 | 7.00 | 6.94 | 8.34 | 6.97 | 11.64 | 13.75 | 7.40 | 7.88 | 7.02 | 7.05 | 8.33 | 8.73 | 8.24 | 8.20 | 8.21 |
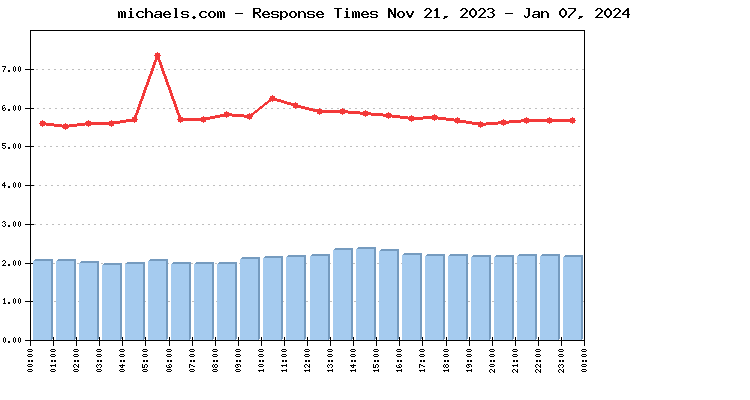
Average response times by hour November 21, 2023 - January 07, 2024
| Target | Hours | |||||||||||||||||||||||
| 00 | 01 | 02 | 03 | 04 | 05 | 06 | 07 | 08 | 09 | 10 | 11 | 12 | 13 | 14 | 15 | 16 | 17 | 18 | 19 | 20 | 21 | 22 | 23 | |
| amazon | 5.92 | 5.89 | 5.92 | 5.86 | 5.87 | 5.88 | 5.86 | 5.87 | 5.89 | 5.95 | 5.97 | 6.01 | 6.06 | 6.09 | 6.08 | 5.98 | 5.97 | 6.00 | 5.93 | 5.92 | 5.97 | 6.11 | 6.07 | 6.08 |
| biglots | 2.20 | 2.16 | 2.21 | 2.25 | 2.46 | 2.38 | 2.41 | 2.29 | 2.31 | 2.21 | 2.30 | 2.25 | 2.16 | 2.25 | 2.23 | 2.28 | 2.22 | 2.23 | 2.21 | 2.23 | 2.22 | 2.25 | 2.30 | 2.28 |
| cdw | 4.45 | 4.13 | 4.28 | 4.07 | 4.94 | 22.00 | 5.47 | 4.47 | 4.54 | 4.85 | 5.32 | 4.99 | 4.60 | 4.50 | 4.69 | 4.55 | 4.75 | 4.53 | 4.58 | 4.36 | 4.72 | 4.64 | 4.75 | 4.59 |
| costco | 13.06 | 13.30 | 13.32 | 14.45 | 14.39 | 14.16 | 13.70 | 13.88 | 13.23 | 13.00 | 12.93 | 12.73 | 12.58 | 13.07 | 13.08 | 12.79 | 12.76 | 12.69 | 12.66 | 12.67 | 12.71 | 12.74 | 12.87 | 12.98 |
| gobros | 3.99 | 3.86 | 3.55 | 3.41 | 3.32 | 3.05 | 3.47 | 3.70 | 3.66 | 3.95 | 3.95 | 4.04 | 4.13 | 4.25 | 4.18 | 4.14 | 4.12 | 4.08 | 4.22 | 4.09 | 3.88 | 3.91 | 3.96 | 3.96 |
| hallmark | 3.19 | 3.11 | 3.27 | 3.23 | 3.20 | 3.16 | 3.16 | 3.13 | 3.13 | 3.12 | 3.21 | 3.19 | 3.26 | 3.26 | 3.24 | 3.31 | 3.21 | 3.26 | 3.19 | 3.15 | 3.22 | 3.27 | 3.29 | 3.26 |
| la-z-boy | 6.33 | 6.66 | 7.40 | 7.11 | 7.13 | 7.07 | 7.14 | 7.97 | 9.76 | 8.47 | 11.99 | 9.77 | 8.90 | 7.66 | 7.11 | 7.20 | 7.11 | 7.32 | 7.05 | 6.59 | 6.35 | 6.43 | 6.40 | 6.37 |
| michaels | 2.05 | 2.04 | 1.99 | 1.94 | 1.97 | 2.03 | 1.95 | 1.95 | 1.97 | 2.08 | 2.11 | 2.13 | 2.18 | 2.31 | 2.35 | 2.30 | 2.19 | 2.16 | 2.17 | 2.14 | 2.15 | 2.16 | 2.18 | 2.15 |
| officedepot | 6.09 | 5.97 | 6.11 | 5.81 | 5.95 | 5.82 | 5.92 | 5.91 | 5.95 | 6.03 | 6.23 | 6.36 | 6.25 | 6.33 | 6.28 | 6.19 | 6.27 | 6.23 | 6.28 | 6.13 | 6.16 | 6.18 | 6.20 | 6.46 |
| rileyhome | 8.60 | 8.17 | 7.98 | 7.89 | 7.91 | 8.08 | 7.97 | 7.96 | 7.87 | 8.07 | 8.35 | 9.17 | 8.85 | 9.35 | 9.49 | 9.41 | 8.78 | 9.11 | 8.62 | 8.43 | 8.82 | 9.02 | 8.67 | 8.76 |
Uptime
Uptime January 07, 2024
| # | Target | Los Angeles | Chicago | Washington | Avg. uptime |
|---|---|---|---|---|---|
| 1 | hallmark.com | 100.000% | 100.000% | 100.000% | 100.000% |
| 2 | officedepot.com | 100.000% | 100.000% | 100.000% | 100.000% |
| 3 | michaels.com | 100.000% | 100.000% | 100.000% | 100.000% |
| 4 | gobros.com | 100.000% | 100.000% | 100.000% | 100.000% |
| 5 | rileyhome.com | 100.000% | 100.000% | 100.000% | 100.000% |
| 6 | biglots.com | 100.000% | 100.000% | 100.000% | 100.000% |
| 7 | la-z-boy.com | 100.000% | 100.000% | 100.000% | 100.000% |
| 8 | costco.com | 99.860% | 100.000% | 100.000% | 99.953% |
| 9 | amazon.com | 100.000% | 99.730% | 100.000% | 99.910% |
| 10 | cdw.com | 99.250% | 99.440% | 98.480% | 99.057% |
Uptime November 21, 2023 - January 07, 2024
| # | Target | Los Angeles | Chicago | Washington | Avg. uptime |
|---|---|---|---|---|---|
| 1 | gobros.com | 100.000% | 100.000% | 100.000% | 100.000% |
| 2 | costco.com | 99.997% | 100.000% | 100.000% | 99.999% |
| 3 | officedepot.com | 99.998% | 99.998% | 100.000% | 99.998% |
| 4 | amazon.com | 100.000% | 99.994% | 100.000% | 99.998% |
| 5 | michaels.com | 100.000% | 99.996% | 99.994% | 99.997% |
| 6 | hallmark.com | 99.894% | 99.894% | 99.900% | 99.896% |
| 7 | rileyhome.com | 99.857% | 99.872% | 99.869% | 99.866% |
| 8 | biglots.com | 99.867% | 99.862% | 99.862% | 99.864% |
| 9 | la-z-boy.com | 99.219% | 99.928% | 99.946% | 99.698% |
| 10 | cdw.com | 98.844% | 98.662% | 98.785% | 98.764% |
Methodology:
The 2023 Holiday Season Reports reflect a complete web transaction, representative for the End Users' interactions with a website. The reporting period covers the dates between November 21, 2023 and January 7, 2024 Performance and availability measurements are made for a typical multi-step web transaction at 15 minute monitoring interval, every day 24/7. The WebSitePulse application monitoring service is used to collect data and to create the reports.
The steps in each transaction are comparable for all websites, and reflect the real online shopper experience. The simultaneous monitoring is performed from 3 US-based locations of the WebSitePulse monitoring network: Los Angeles, CA, Chicago, IL, and Washington, DC. In case of a detected malfunction or unavailability, the system performs automated error verification from 3 independent resources and only after the above procedure is performed and has returned consistent results, the detected error is confirmed, recorded, and included in the daily performance reports. In these cases, an advanced WebSitePulse exclusive feature comes into play - Forced Monitoring -, which automatically switches to a 3 minute monitoring interval for increased accuracy.
About WebSitePulse:
WebSitePulse is a leading provider of global, independent, and objective availability and performance monitoring of web sites, servers, network components, web applications, e-business- and email round-trip transactions.
Contact:
For more information about this report please contact:
George T., CTO
phone: 1-407-380-1600
email:
Reproduction:
WebSitePulse launched the Performance and Uptime Reports program to keep the general public and the Internet community informed about the performance of specific websites and the challenges their webmasters, owners and operators are facing on a daily basis, especially when the web traffic intensifies due to some special events through the year. Some of the most popular web destinations, related to each particular event, are selected for the purpose of the Reports, and data from their performance measurements is made available on the WebSitePulse public website.
With the intention to broadly disseminate this information for the benefit of the Internet community, we encourage the use of this information without prior approval and under the following Terms and Conditions:
- WebSitePulse should be referred as the "Source" of the information;
- WebSitePulse should be acknowledged as the owner of the copyrights of the information in the Reports;
- The texts of the Reports could be changed or altered to better suit the needs and the style of the publisher without prior notice to WebSitePulse. However, the integrity and the meaning of the information should be preserved;
The Data from the performance measurements cannot be changed or manipulated and should be used "as is".